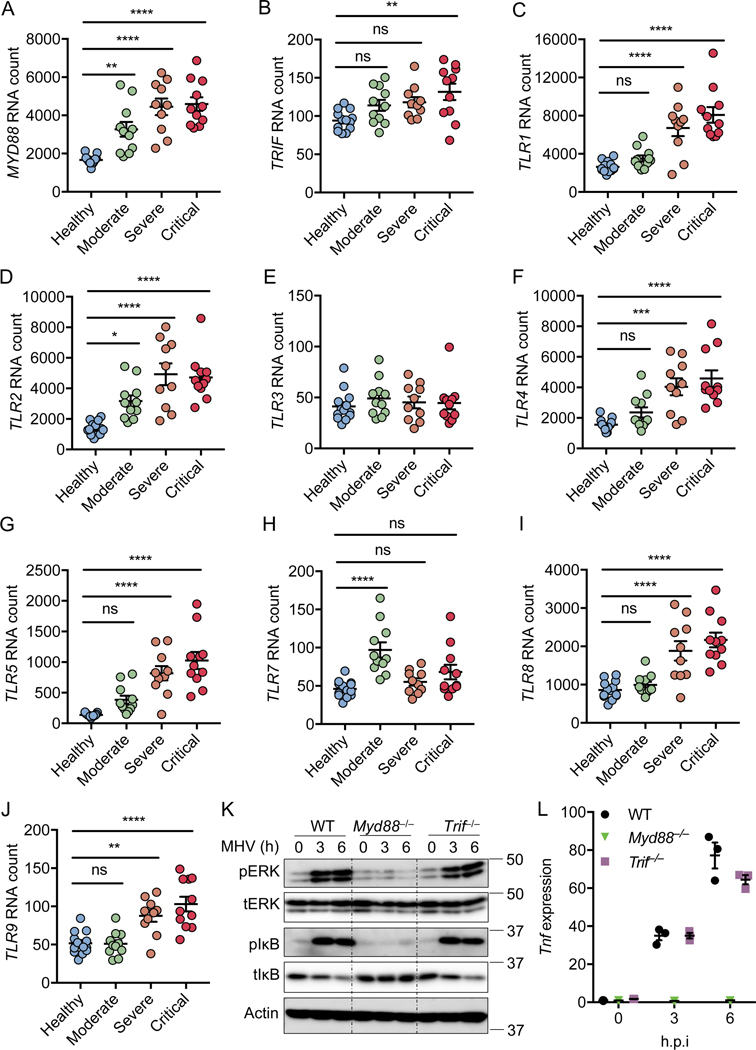
Figure 1. MYD88 and TLRs are associated with the severity of COVID-19.
(A–J) Absolute RNA counts of MYD88 (A), TRIF (B), TLR1 (C), TLR2 (D), TLR3 (E), TLR4 (F), TLR5 (G), TLR7 (H), TLR8 (I), and TLR9 (J) in patients with mild-to-moderate (n = 11), severe (n = 10), and critical (n = 11) COVID-19, and 13 healthy controls16. (K) Immunoblot analysis of phospho-ERK (pERK), total ERK (tERK), pIκB, and tIκB in WT, Myd88–/–, and Trif–/– bone marrow-derived macrophages (BMDMs) after infection with MHV at a MOI of 0.1 for the indicated time. Actin was used as the internal control. (L) Real-time PCR analysis of Tnf expression in WT, Myd88–/–, and Trif–/– BMDMs after infection with MHV at a MOI of 0.1 for the indicated time, presented relative to levels of the host gene Gapdh. Significant differences compared to the healthy group are denoted as *P < 0.05, **P < 0.01, ***P < 0.001, and ****P < 0.0001; ns: not significant (one-way ANOVA). Exact P values are presented in Supplementary Table 1. Data are shown as mean ± SEM (A–J, L). Data are representative of three independent experiments (K and L).

