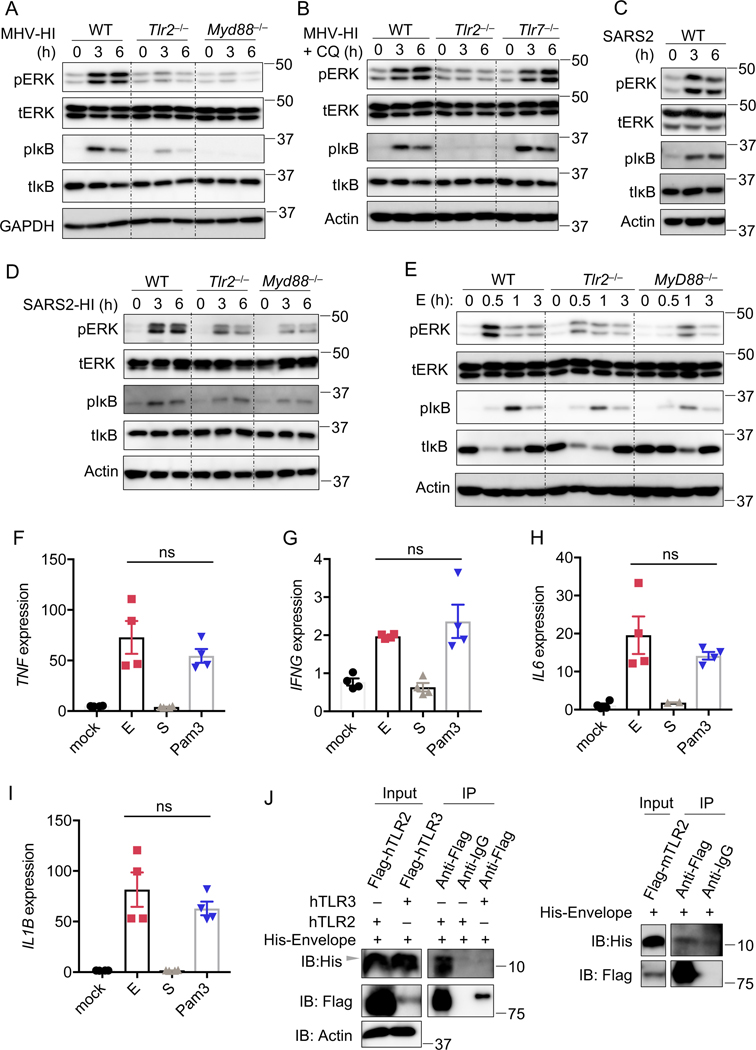
Figure 3. TLR2 can sense the envelope protein of β-coronaviruses.
(A) Immunoblot analysis of phospho-ERK (pERK), total ERK (tERK), pIκB, and tIκB in WT, Tlr2–/–, and Myd88–/– bone marrow-derived macrophages (BMDMs) after stimulation with heat-inactivated MHV (MHV-HI) at a MOI of 0.1 for the indicated time. GAPDH was used as the internal control. (B) Immunoblot analysis of pERK, tERK, pIκB, and tIκB in WT, Tlr2–/–, and Tlr7–/– BMDMs after stimulation with MHV-HI for the indicated time. Chloroquine (CQ) at a final concentration of 10 μM was added 30 min before the stimulation. Actin was used as the internal control. (C) Immunoblot analysis of pERK, tERK, pIκB, and tIκB in WT BMDMs after stimulation with SARS-CoV-2 for the indicated time. Actin was used as the internal control. (D) Immunoblot analysis of pERK, tERK, pIκB, and tIκB in WT, Tlr2–/–, and Myd88–/– BMDMs after stimulation with heat-inactivated SARS-CoV-2 (SARS2-HI) for the indicated time. Actin was used as the internal control. (E) Immunoblot analysis of pERK, tERK, pIκB, and tIκB in WT, Tlr2–/–, and Myd88–/– BMDMs after stimulation with 1 μg/ml of the envelope (E) protein of SARS-CoV-2 for the indicated time. Actin was used as the internal control. (F–I) Real-time PCR analysis of the expression of TNF (F), IFNG (G), IL6 (H), and IL1B (I) in human peripheral blood mononuclear cells (PBMCs) after stimulation with 1 μg/ml of the E or spike (S) protein from SARS-CoV-2 or Pam3CSK4 (Pam3) for 4 h, presented relative to levels of the host gene GAPDH. (J) Immunoprecipitates and total lysates from 293T cells after incubation of purified E protein from SARS-CoV-2 with overexpressed human TLR2, TLR3 or mouse TLR2. Student’s t test was used for statistical analysis between E and Pam3 treated groups; ns: not significant. Data are representative of three independent experiments (A–J). ns, not significant (two-sided student’s t test) (F–I). Data are shown as mean ± SEM (n = 2 biological replicates plus 2 technical replicates) (F–I).

