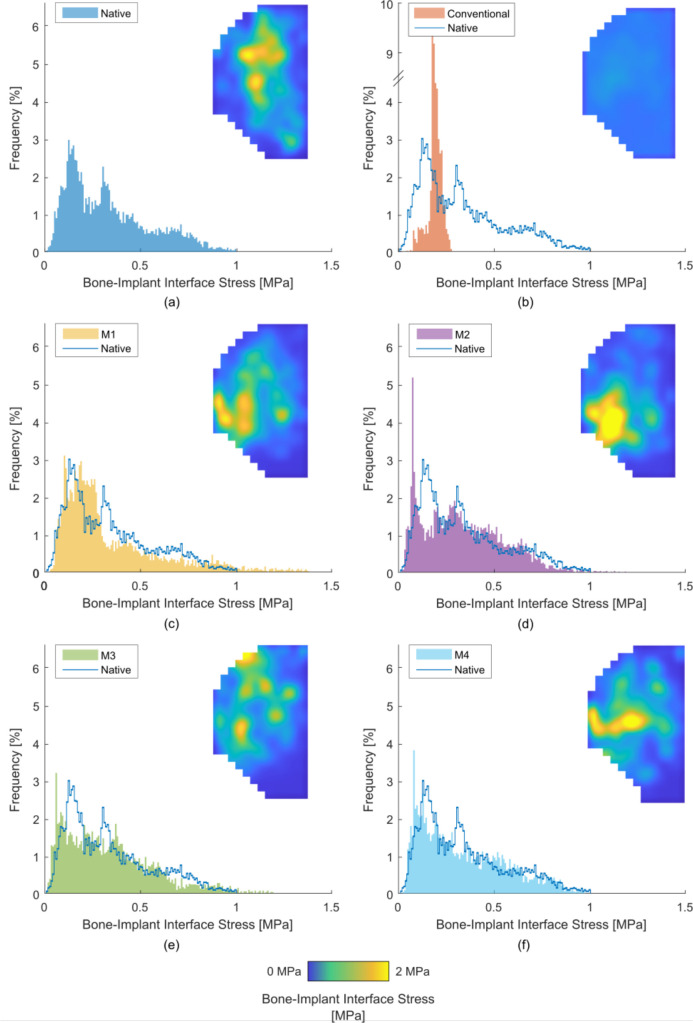
Fig. 3.
Average (across eight specimens) stress maps and histogram plots of bone-implant interface stress in unicompartmental knee arthroplasty for: a) the native case; b) the conventional implant (M0); and c) to f) the additive manufactured lattice variants: c) M1, d) M2, e) M3, and f) M4. Note the break in axis of Figure 3b.

