
Figure 4: Association of HC Z-Score and Clinical Severity.
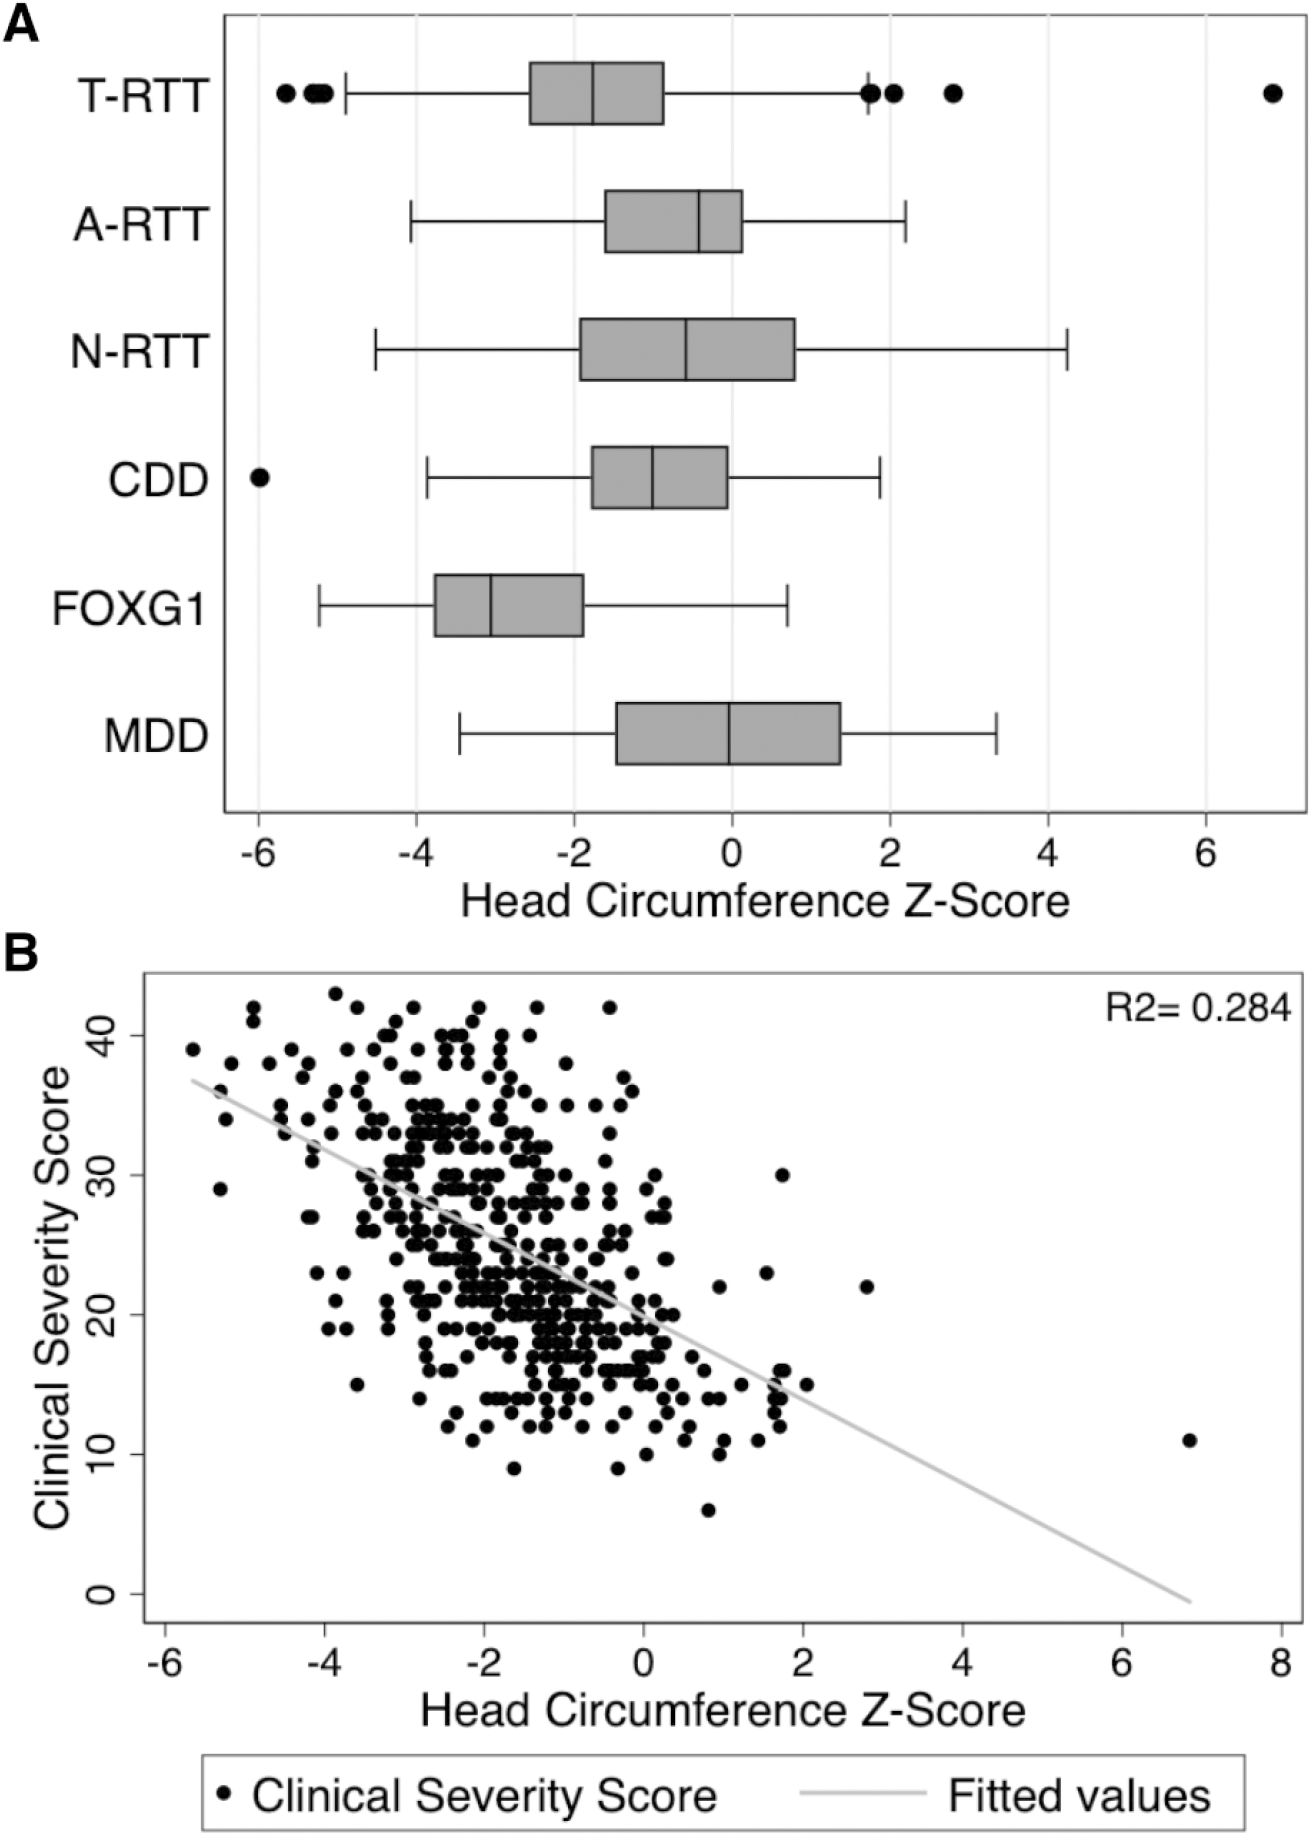
(A) Boxplot of HC Z-score by diagnosis (B) Clinical Severity Scale vs HC Z-score for T-RTT, with linear regression plotted in gray. Similar associations between HC and clinical severity were also observed for the other DEs (see Table 4).