
Fig. 1. Doubly deficient Nod2/Cybb mice develop earlyonset spontaneous CD-like colitis when exposed to a specific microbiota.
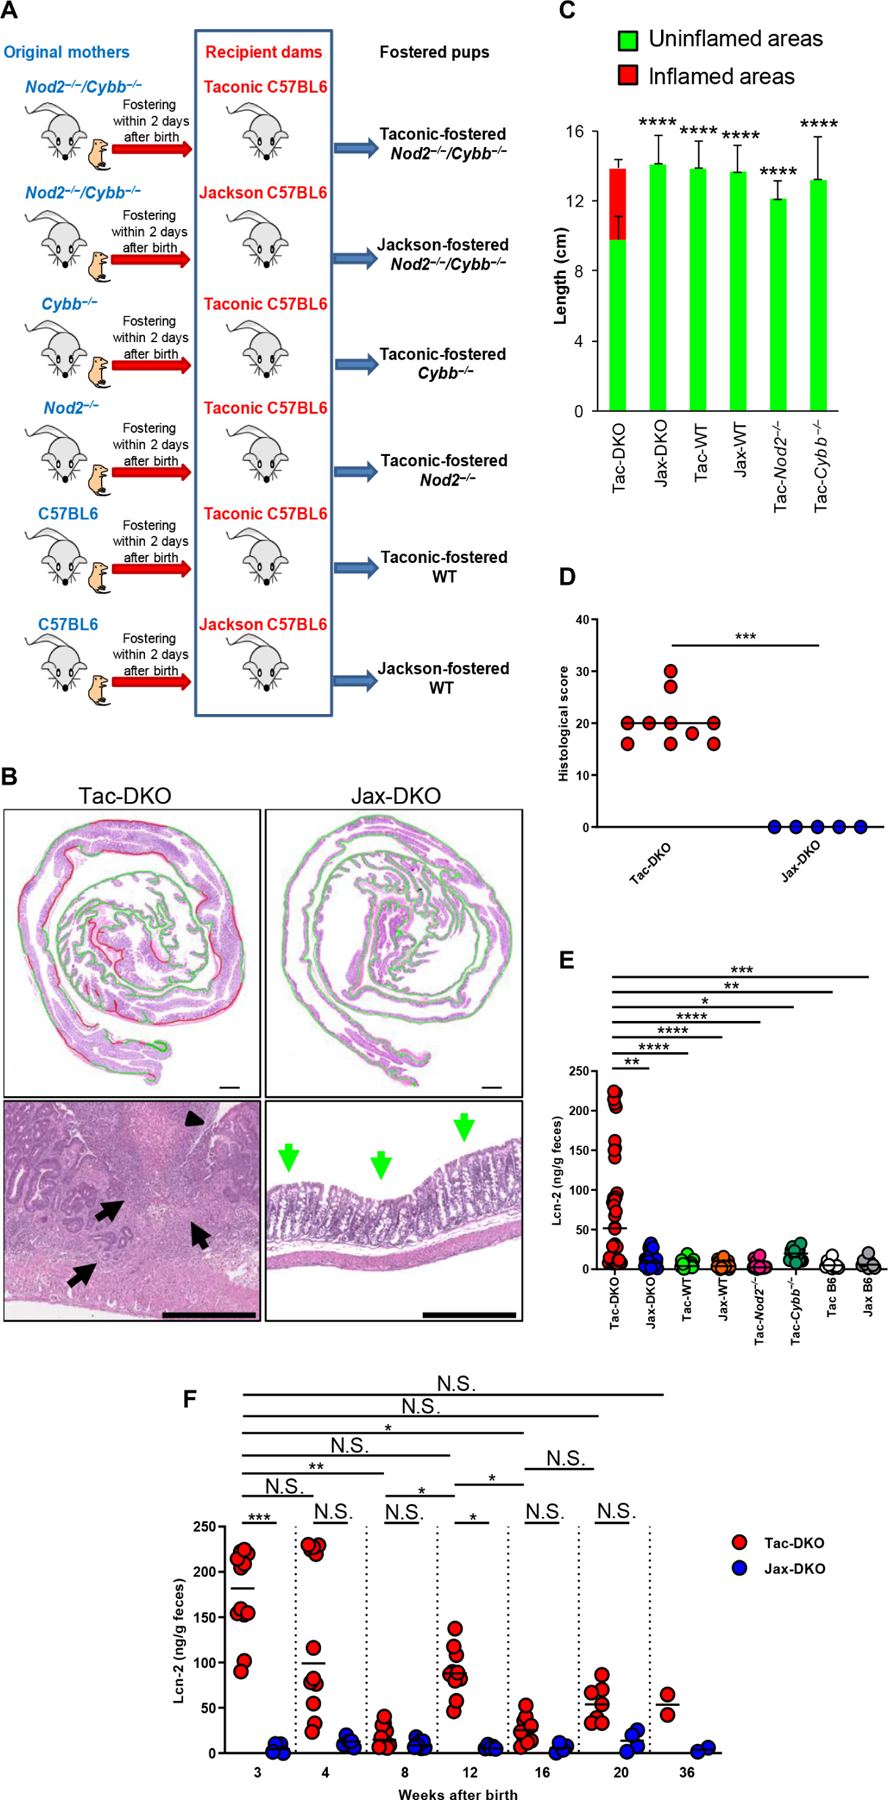
(A) Schematic representation of the experimental design for fostering experiments. WT or mutant pups were fostered to either Jackson (Jax) or Taconic (Tac) dams within 2 days after birth. Six groups of fostered mice were generated: Tac-DKO, Jax-DKO, Tac-WT, Jax-WT, Tac-Nod2−/−, and Tac-Cybb−/−. (B) Representative histology of H&E-stained colonic sections from ~4-week-old Jax-DKO and Tac-DKO mice. Top panels show colonic rolls with inflamed areas (red) and uninflamed areas (green). Scale bars, 1000 μm. Bottom panels show high-powered images. The arrowhead shows a narrow and deep ulcer. Black arrows indicate colonic transmural inflammation and regenerating crypt epithelia in Tac-DKO; green arrows show uninvolved colon in Jax-DKO. Scale bars, 500 μm. (C) Quantification of inflammatory involvement in colons of ~4-week-old fostered mice. Graphs indicate mean ± SD of at least five individual mice. One-way analysis of variance (ANOVA) followed by Tukey’s multiple comparisons test. **** P < 0.0001, data are from four independent experiments. (D) Histopathological scores of cecal and colonic tissues from Tac-DKO (n = 10) and Jax-DKO (n = 5) mice. Bars show median; data are from three independent experiments. Two-tailed Mann-Whitney U test. *** P = 0.0003. (E) Fecal Lcn-2 concentration in Tac-DKO (n = 38), Jax-DKO (n = 24), Tac-WT (n = 20), Jax-WT (n = 19), Tac-Nod2−/− (n = 16), Tac-Cybb−/− (n = 16), Tac C57BL/6 (Tac B6) (n = 10), and Jax C57BL/6 mice (Jax B6) (n = 10). Non-fostered Tac C57BL/6 (Tac B6) and Jax C57BL/6 (Jax B6) mice are included as controls. Bars show median; data are from three independent experiments. (F) Lcn-2 concentration was measured over time in fecal samples from Tac-DKO (n ≤ 12) and Jax-DKO (n ≤ 7) mice. Bars show median; data are pooled from three independent experiments. (E and F) Kruskal-Wallis test followed by Dunn’s post test. * P < 0.05; ** P < 0.01; *** P < 0.001; **** P < 0.0001; N.S., not significant.