
Fig. 2. Doubly deficient Nod2/Cybb mice harboring Taconic microbiota develop TH1-type colitis.
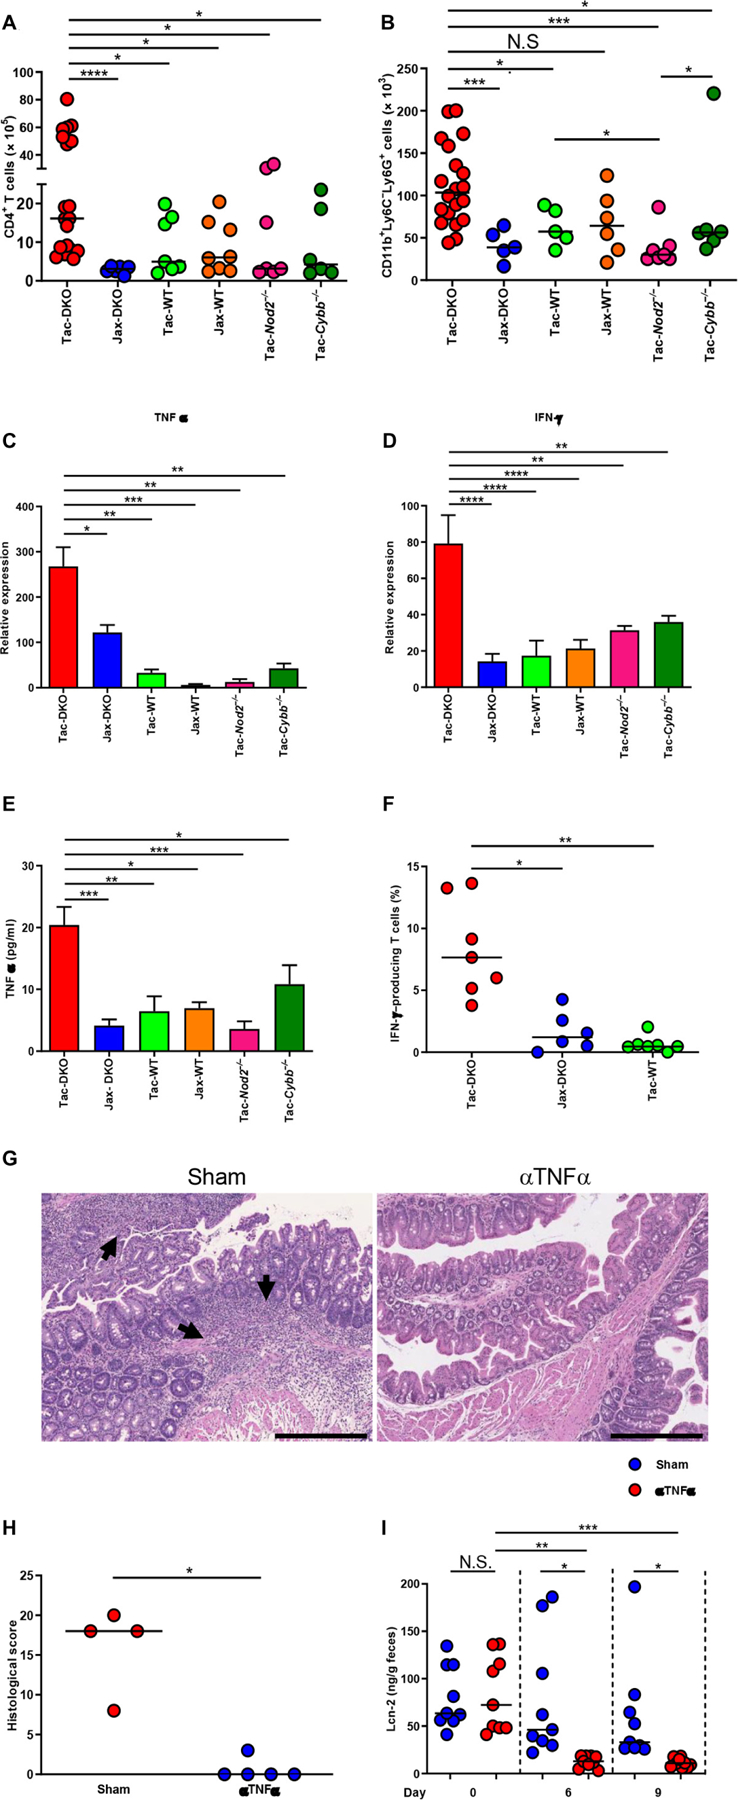
(A) Total number of LP CD4+ T cells from 4-to 6-week-old mice (Tac-DKO, n = 19; Jax-DKO, n = 6; Tac-WT, n = 7; Jax-WT, n = 8; Tac-Nod2−/−, n = 7; and Tac-Cybb−/−, n = 6). (B) Total number of LP neutrophils from 4- to 6-week-old mice (Tac-DKO, n = 20; Jax-DKO, n = 5; Tac-WT, n = 5; Jax-WT, n = 6; Tac-Nod2−/−, n = 7; and Tac-Cybb−/−, n = 6). (A and B) Bars show median; data are from five independent experiments. Kruskal-Wallis test followed by Dunn’s post test. *P < 0.05; ***P < 0.001; ****P < 0.0001. (C and D) LPMCs were isolated from 4- to 6-week-old fostered mice. Gene expression in LPMCs was normalized to glyceraldehyde-3-phosphate dehydrogenase (GAPDH) expression. Data are mean ± SEM of at least five individual mice; data are from four independent experiments. *P < 0.05; **P < 0.01; ***P < 0.001; ****P < 0.0001 by one-way ANOVA followed by Tukey’s multiple comparisons test. (E) Total LPMCs from 4- to 6-week-old fostered mice were cultured for 12 hours. TNFα from culture supernatant was measured by ELISA (at least three individual mice each group). Data are mean ± SEM; data are from two independent experiments. *P < 0.05; **P < 0.01; ***P < 0.001 by one-way ANOVA followed by Tukey’s multiple comparisons test. (F)Percentages of IFN-γ–producing CD4+ T cells isolated from 4- to 6-week-old Tac-DKO (n = 7), Jax-DKO (n = 6), and Tac-WT (n = 7). Each dot represents an individual mouse. Bars show median; data are from three independent experiments. *P < 0.05; **P < 0.01 by Kruskal-Wallis test followed by Dunn’s multiple comparisons test. (G) Representative histology of H&E-stained colonic sections from Tac-DKO mice injected with anti-TNFα antibody (αTNFα) or control IgG (sham). Arrows show inflammatory cell infiltrate and epithelial crypt damage. Scale bars, 500 μm. (H) Histopathological scores of colonic tissue from anti–TNFα-treated Tac-DKO (n = 5) and from sham-treated Tac-DKO mice (n = 4) on day 9 after injection. Each dot represents an individual mouse. Bars show median; data are from two independent experiments; *P = 0.0159 by two-tailed Mann-Whitney U test. (I) Fecal Lcn-2 concentration in Tac-DKO mice treated with anti-TNFα antibody (n = 9) or control isotype–matched antibody (sham) (n = 9) before injection (day 0) and on day 6 and on day 9 after injection. Bars show median; data are from two independent experiments. Kruskal-Wallis test followed by Dunn’s post test. *P < 0.05; **P < 0.01; ***P < 0.001.