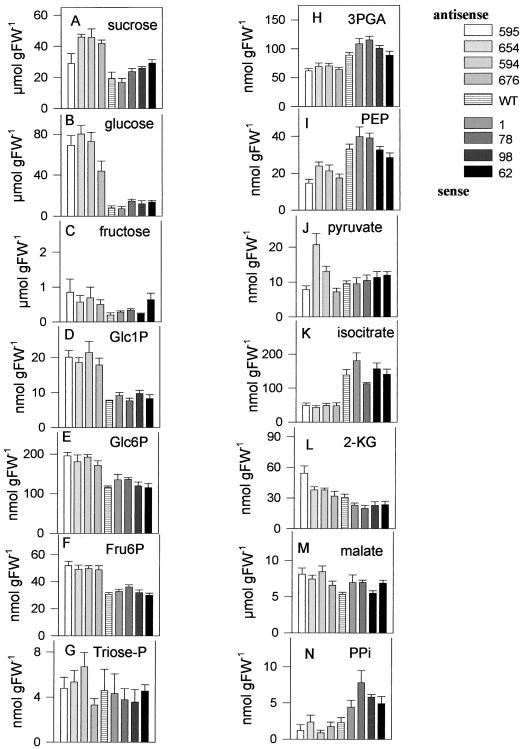
Figure 2.
Sugars and metabolite levels in tubers with altered expression of the AATP. Tuber material was frozen in liquid nitrogen and then extracted in trichloroacetic acid to analyze the levels of Suc (A), Glc (B), Fru (C), Glc1P (D), Glc6P (E), Fru6P (F), triose-P (G), 3PGA (H), PEP (I), pyruvate (J), isocitrate (K), α-ketoglutarate (L), malate (M), and PPi (N). Results are means ± se (n = 5).

