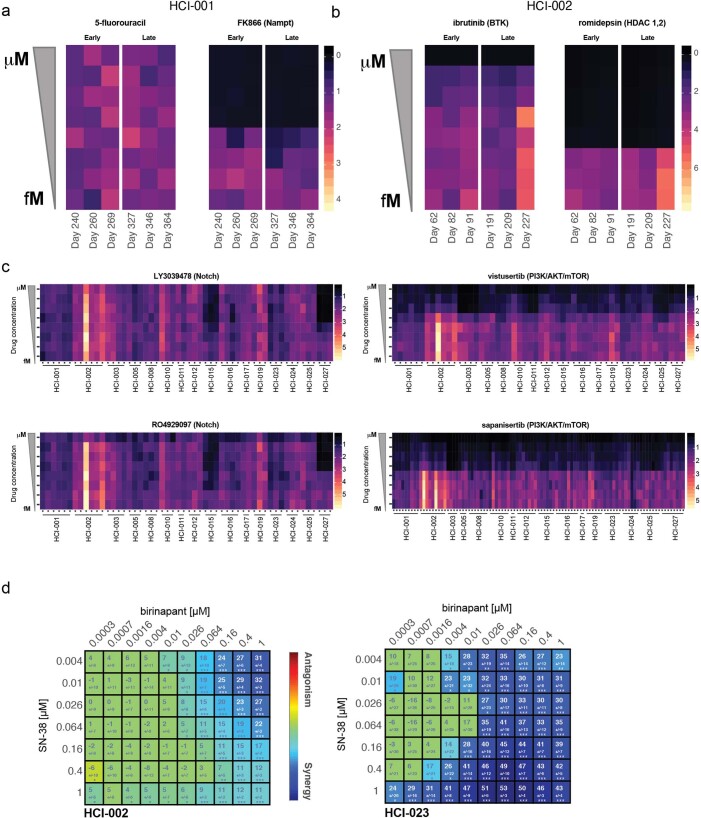
Extended Data Fig. 9. Longitudinal drug screens and synergy.
(a) Two compounds, 5-fluorouracil and FK866 were screened at eight-point dose response curves (y-axis) at different days in culture (x-axis). Individual replicates and dose responses from a CellTiter-Glo 3D cell viability assay were normalized to day 0 for the model HCI-001. Values range from 0 (black) to 4 (light-yellow), where zero indicates cytotoxic effects and yellow shows growth phenotypes. Values at 1 are considered cytostatic. (b) As in the previous panel two compounds, ibrutinib and romidepsin, were screened in model HCI-002 at different times in culture. Here, response values range from 0 (red) to 7 (light-yellow). Values at 1 are considered cytostatic. (c) Individual biological replicates for 16 models are shown for two different targeted therapies in the Notch pathway (LY3039478 and RO4929097), as well as two targeted therapies in the mTOR pathway (vistuserib and sapanisertib). Colored as previously described in panel (a). Response values range from 0 (black) to 5 (light-yellow). Values at 1 are considered cytostatic. (d) Synergy plot as a result of drug treatment of birinapant and SN-38 in HCI-002 (left) and HCI-023 PDxOs (right). Blue indicates synergy and red indicates antagonism. The number in the box represents the Lowe synergy score + /- standard deviation as provided by Combenefit software; Screen was performed in n=12 replicates as defined in methods section. Statistical differences are reported by the software as one sample t-test and *p < .05, **p < .001, ***p < .0001.

