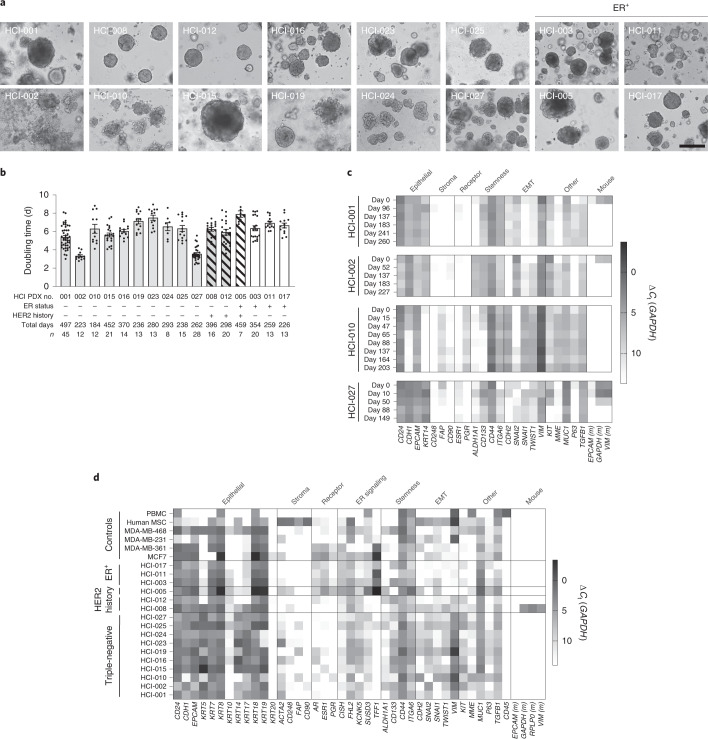
Fig. 4. Characterization of established PDxOs.
a, Brightfield images of established PDxO lines to show characteristic morphology at maturity; scale bar, 50 μm. b, Culture doubling times for each established PDxO line over long-term culture. Each dot indicates a culture passage; n is indicated below the x axis; error bars represent ±s.e.m. c, Expression of PDxO characterization genes in HCI-001, HCI-002, HCI-010 and HCI-027 PDxOs at different culture time points. Data are normalized to GAPDH and represent technical replicates of n = 4; EMT, epithelial-to-mesenchymal transition. d, Expression of PDxO characterization genes at single time points for representative PDxOs, validating their human epithelial nature and subtype status, with additional markers to highlight diversity across different lines. Data are normalized to GAPDH and represent technical replicates of n = 4; PBMC, peripheral blood mononuclear cells; MSC, mesenchymal stem cells.

