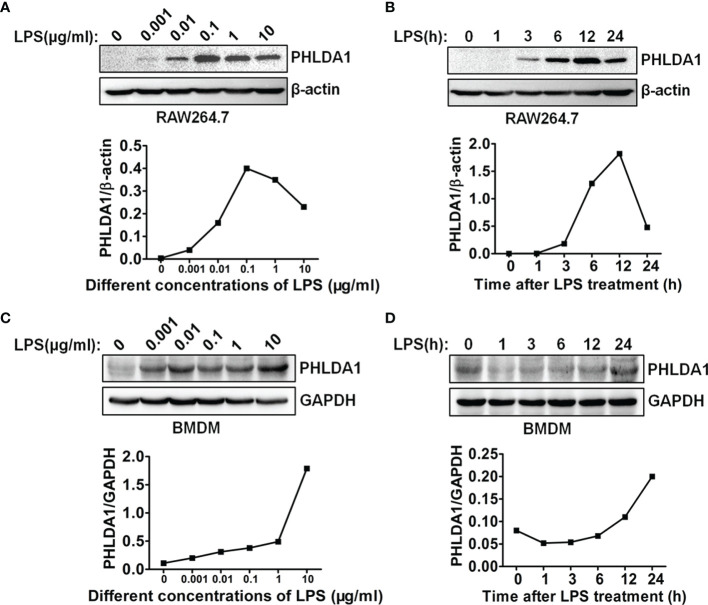
Figure 1.
LPS regulates PHLDA1 expression in macrophages. RAW264.7 cells (A) and BMDM (C) were treated with the different concentrations (0.001, 0.01, 0.1, 1, and 10 μg/ml) of LPS for 24 h. Western blot was used to measure PHLDA1 expression. RAW264.7 cells (B) and BMDM (D) were treated with LPS (0.1 μg/ml) for 0, 1, 3, 6, 12, and 24 h. Western blot was used to measure PHLDA1 expression. β-Actin or GAPDH was used as a loading control. The data are representative of three independent experiments. The quantified results of PHLDA1 expression are shown in the lower panel.

