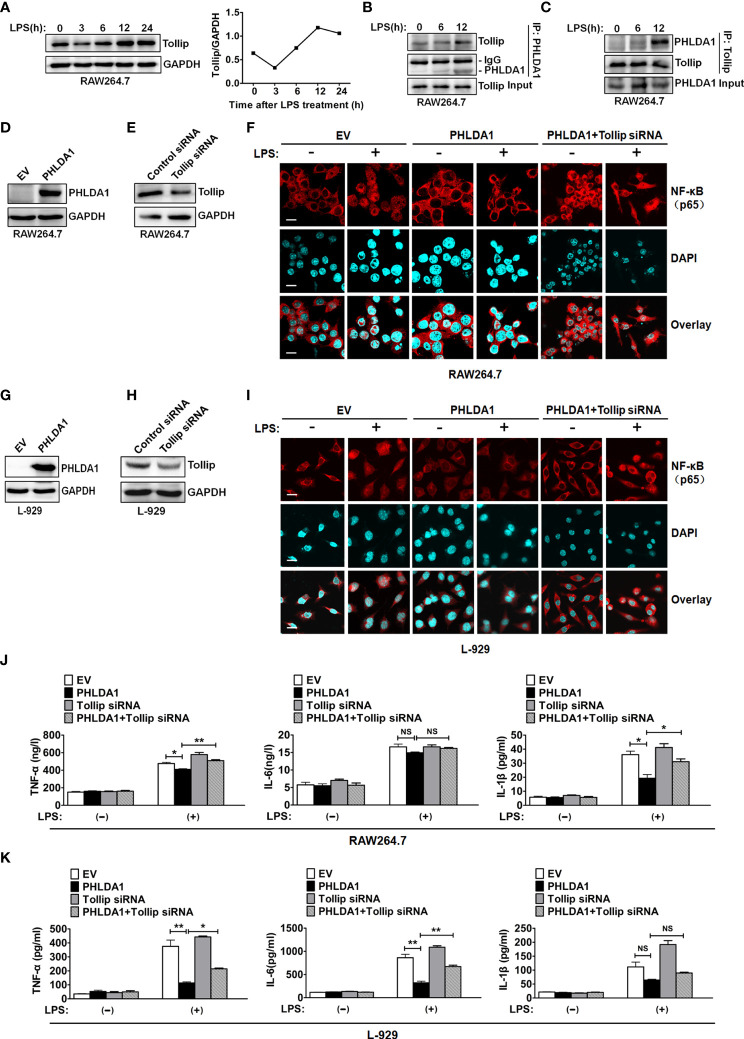
Figure 5.
PHLDA1 recruits Tollip to attenuate LPS-initiated NF-κB nuclear translocation and proinflammatory cytokine production. (A) RAW264.7 cells were treated with LPS (0.1 μg/ml) for 0, 3, 6, 12, and 24 h. Tollip expression was detected with Western blot. GAPDH was used as loading control. The quantified result of Tollip expression is shown in the right panel. (B, C) RAW264.7 cells were treated with 0.1 μg/ml LPS for 0, 6, and 12 h. Co-IP and Western blot analysis were used to measure the interaction between PHLDA1 and Tollip. RAW264.7 cells (D, E) and L-929 cells (G, H) were transfected with EV or PHLDA1 plasmid, Control siRNA, or Tollip siRNA, respectively. Protein expressions of PHLDA1 and Tollip were measured with Western blot. GAPDH was used as an internal control for gene expression analysis. RAW264.7 cells (F) and L-929 cells (I) were transfected with EV, PHLDA1 plasmid, and PHLDA1 plasmid plus Tollip siRNA and then treated with LPS (0.1 μg/ml) for 1 h. The above cells were fixed and stained for NF-κB (p65). Nuclei were stained with DAPI. The merged images were captured with a confocal microscope (scale bar, 20 μm). RAW264.7 cells (J) and L-929 cells (K) were transfected with EV, PHLDA1 plasmid, Tollip siRNA, and PHLDA1 plasmid plus Tollip siRNA and then treated with LPS (0.1 μg/ml) for 12 h. ELISA was performed to measure the production of proinflammatory cytokines (TNF-α, IL-6, and IL-1β). Data are shown as mean ± SD of three independent experiments (NS means no significance, *P < 0.05; **P < 0.01). Western blot data are representative of three independent experiments.

