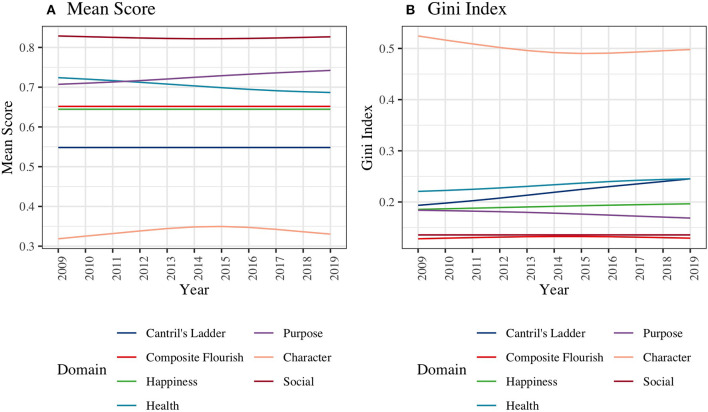
Figure 3.
Global Trend of (A) Mean and (B) Inequality for the Composite Flourishing and Each Domain of Flourishing from 2009 to 2019. To facilitate comparison with the domain-specific scores, the mean composite flourishing scores and Cantril's Ladder scale scores were re-scaled to range from 0 to 1. We computed mean scores and Gini indices of all the wellbeing measures for each country and year and then plotted smoothed curves for global trajectories.

