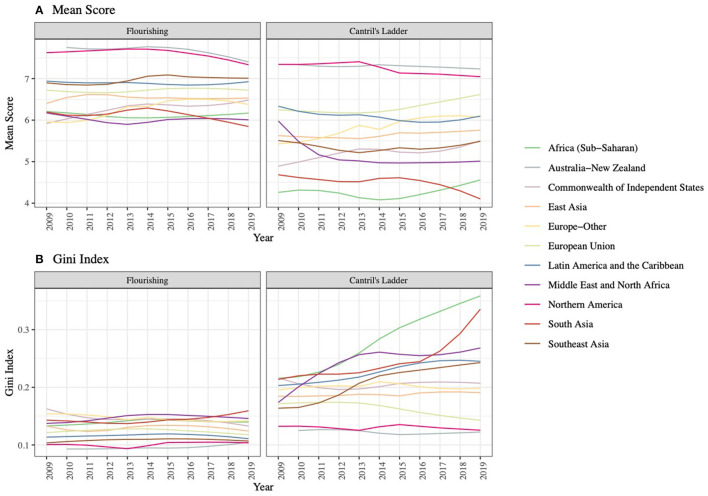
Figure 4.
Trajectories of (A) Mean Score and (B) Gini Index for Flourishing and Cantril's Ladder from 2009 to 2019 by Regions. We computed mean scores and Gini indices of the composite flourishing and Cantril's ladder for each country and year and then plotted smoothed curves for trajectories in each region.

