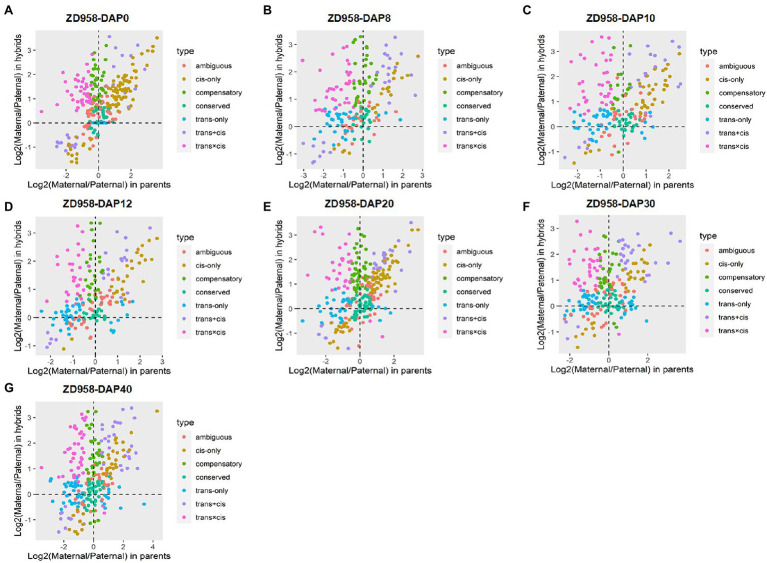
Figure 3.
Plots of allele-specific expression levels in Zhengdan958 (ZD958) and its parental data set at seven developmental stages. (A–G) represent DAP0, DAP8, DAP10, DAP12, DAP20, DAP30, and DAP40, respectively. Each point represents a gene and is color-coded according to the types of regulatory divergence.

