Fig. 1.
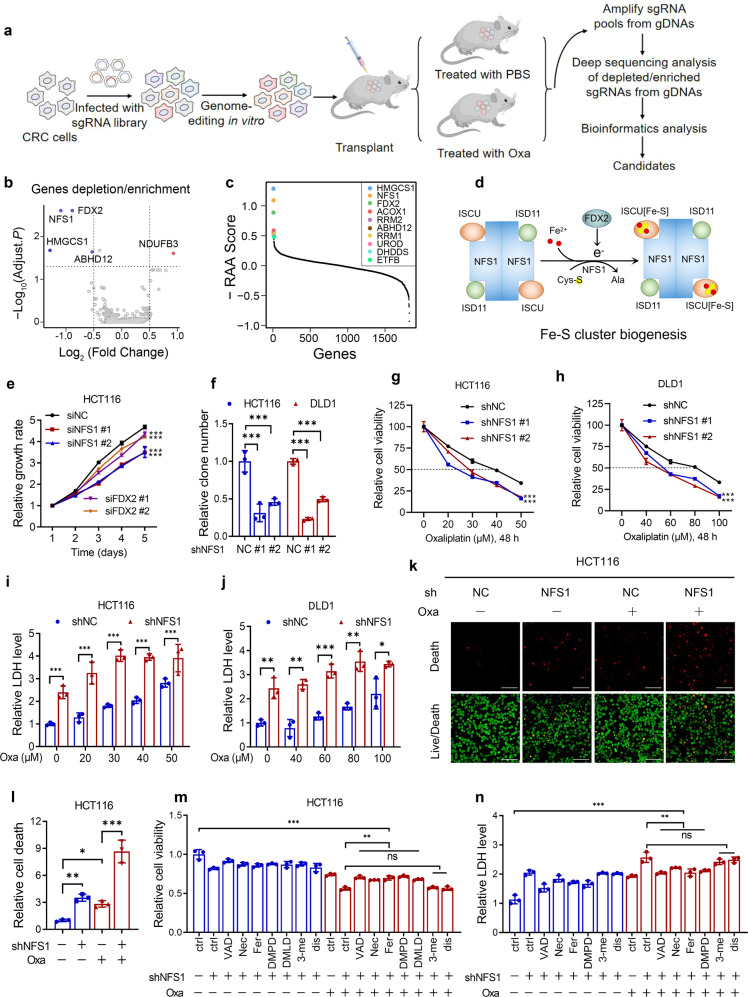
In vivo CRISPR screening reveals that NFS1 deficiency enhances the sensitivity of CRC cells to oxaliplatin (Oxa). a Diagram showing the strategy of the CRISPR-based screen in vivo (n = 6). b Volcano plot illustrating the depleted or enriched genes in the oxaliplatin-treatment group compared with the control group based on the depletion or enrichment of sgRNAs. Each dot represents a gene whose knockout can enhance (blue) or reduce (red) the sensitivity of cells to oxaliplatin treatment. c Illustration of the top ten candidates depleted in the oxaliplatin-treatment group. The analyzed CRISPR screening data are provided in Supplementary Table S5. d Schematic illustration of Fe–S cluster biogenesis and the main enzymes involved in this process. e MTS analysis of the proliferation of HCT116 cells in which NFS1 or FDX2 is silenced. f Quantification of colony formation analysis reflecting the proliferation of control and NFS1-knockdown HCT116 and DLD1 cells. g, h Cell viability of HCT116 and DLD1 cells treated with different concentrations of oxaliplatin for 48 h after NFS1 knockdown. i, j LDH analysis indicating the cytotoxicity of different concentrations of oxaliplatin for 48 h in HCT116 and DLD1 cells with NFS1 knockdown. k Live/dead viability/cytotoxicity assay showing the dead (red) and live (green) cells among control and NFS1-knockdown HCT116 cells treated with 40 µM oxaliplatin for 24 h. Scale bar = 100 μm. l Quantification of the relative number of dead cells in (k). m, n Cell viability (m) and cytotoxicity (n) assessments of control and NFS1-knockdown HCT116 cells treated or not treated with 40 µM oxaliplatin for 24 h in combination with the apoptosis inhibitor Z-VAD-FMK (VAD, 25 µM), the necroptosis inhibitor necrostatin (Nec, 20 µM), the ferroptosis inhibitor ferrostatin-1 (Fer, 10 µM), the pyroptosis inhibitors Ac-DMPD/DMLD-CMK (DMPD/DMLD, 20 µM) and disulfiram (dis, 1 µM) or the autophagy inhibitor 3-methyladenine (3-me, 10 µM). The data in (e–j) and (l–n) are representative of three independent experiments and presented as the mean ± SD. The P values in (e–h) were calculated by two-way ANOVA with Dunnett’s multiple comparisons test, those in (l–n) were calculated by one-way ANOVA with Tukey’s multiple comparisons test, and those in (i, j) were calculated by two-tailed unpaired Student’s t test. *P < 0.05, **P < 0.01, ***P < 0.001

