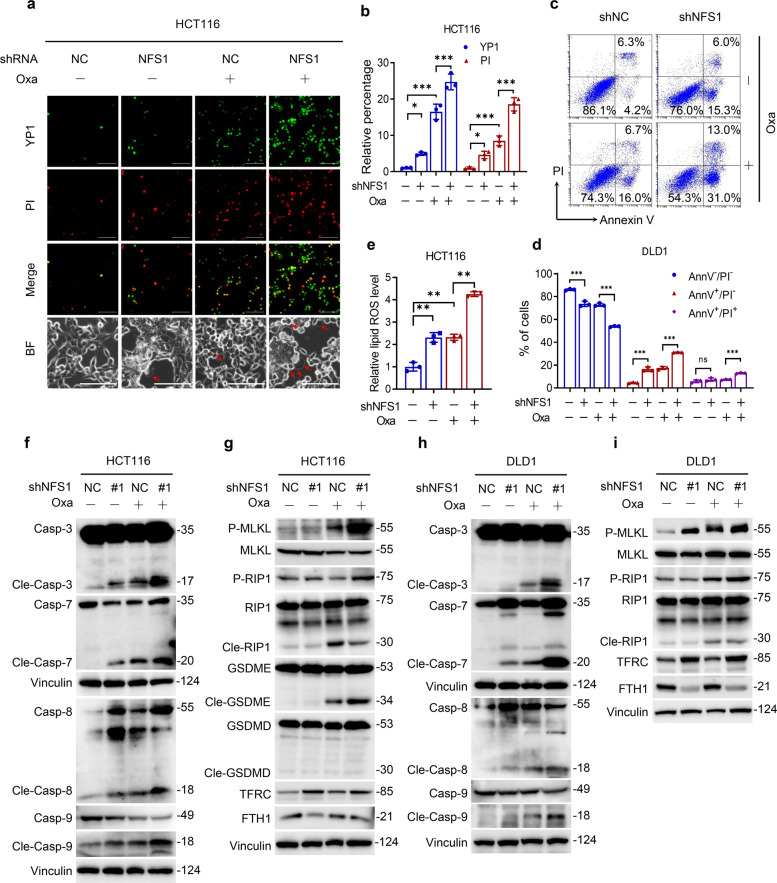
Fig. 2.
NFS1 deficiency synergizes with oxaliplatin treatment to induce PANoptosis. a Representative images showing YP1+ cells (green) that may undergo apoptosis or necroptosis and PI+ cells (red) that may undergo apoptosis, necroptosis, pyroptosis, or ferroptosis in control and NFS1-knockdown HCT116 cells treated with 40 µM oxaliplatin for 24 h. The bottom panel shows representative bright fields, and the red arrowheads indicate the large bubbles emerging from the plasma membrane. Scale bar = 100 μm. b Quantification of the YP1+ and PI+ cells from (a). c, d Flow cytometry (c) and quantification analysis (d) with Annexin V/PI staining evaluating the percentages of live cells (Annexin V−/PI−), early apoptotic cells (Annexin V+/PI−) and late apoptotic cells (Annexin V+/PI+) among the control and NFS1-knockdown DLD1 cells treated with PBS or oxaliplatin (80 μM, 24 h). e The lipid ROS levels in control and NFS1-knockdown HCT116 cells treated with oxaliplatin (40 μM, 24 h) were assessed by the BODIPY™ 581/591 C11 probe assay. f–i Western blotting analysis of caspase-3, cleaved caspase-3, caspase-7, cleaved caspase-7, caspase-8, cleaved caspase-8, caspase-9, cleaved caspase-9, phosphorylated MLKL, total MLKL, phosphorylated RIP1, total RIP1, cleaved RIP1, GSDME, cleaved GSDME, GSDMD, cleaved GSDMD, TFRC, FTH1 expression in control and NFS1-knockdown HCT116 (f, g) and DLD1 (h, i) cells treated with oxaliplatin (40 μM for HCT116 and 80 μM for DLD1, 24 h), GSDME and GSDMD are not expressed in DLD1 cells. Vinculin was included as a loading control. The data in (b, d, e) are representative of three independent experiments and presented as the mean ± SD. The P values in (b, d) were calculated by two-way ANOVA and those in (e) were calculated by one-way ANOVA with Tukey’s multiple comparisons test. *P < 0.05, **P < 0.01, ***P < 0.001

