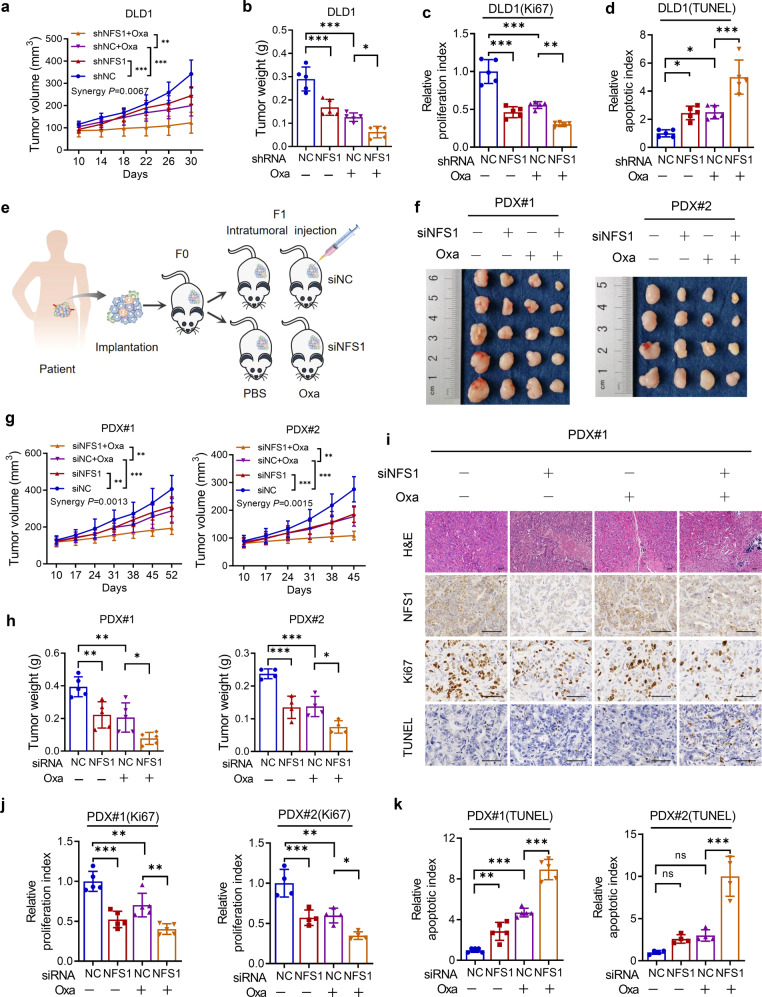
Fig. 3.
NFS1 deficiency enhances the antitumor effect of oxaliplatin in vivo. a, b Statistical analysis of CDX tumor volumes (a) and weights (b) in nude mice after implantation of NFS1-knockdown or control DLD1 cells, followed by i.p. injection of oxaliplatin (7.5 mg/kg) or PBS (n = 5, Bliss synergy P value is shown). c, d Quantification of the proliferation index (Ki67 staining) (c) and apoptotic index (TUNEL staining) (d) of DLD1-based xenograft tumors. e Illustration of the methodology used to establish CRC PDX models. f Photographs of the excised tumors from PDX #1 (left) and PDX #2 (right) models after intratumoral injection of in vivo-optimized NFS1 inhibitor (siNFS1) or the control, followed by i.p. injection of oxaliplatin (7.5 mg/kg) or PBS (PDX #1, n = 5; PDX #2, n = 4) and comparison of the tumor sizes. g, h Statistical analysis of the tumor volumes (g, Bliss synergy P values are shown) and weights (h) in nude mice from the PDX #1 (left) and PDX #2 (right) models. i Representative H&E and IHC staining images of NFS1, Ki67, and TUNEL in PDX #1-based paraffin-embedded subcutaneous tumor sections. Scale bar = 50 μm. j, k Quantification of the proliferation index (Ki67 staining) (j) and apoptotic index (TUNEL staining) (k) of the PDX #1 (left) and PDX #2 (right) models. The data in (a–d, g, h, j, k) (PDX #1) are representative of five independent experiments and those in (g, h, j, k) (PDX #2) are representative of four independent experiments. All the data are presented as mean ± SD. The P values in (a, g) were calculated by two-way ANOVA, and those in (b–d, h, j, k) were calculated by one-way ANOVA with Tukey’s multiple comparisons test. *P < 0.05, **P < 0.01, ***P < 0.001

