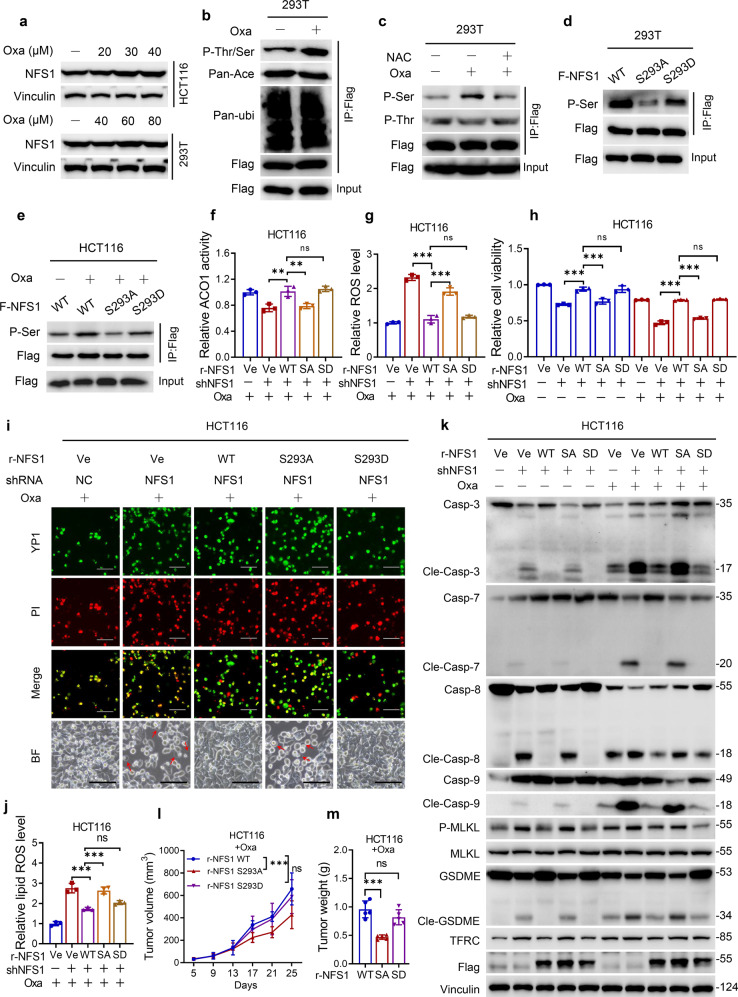
Fig. 5.
NFS1 prevents PANoptosis under oxaliplatin treatment depending on its phosphorylation level at S293. a Western blotting detection of NFS1 expression in HCT116 and 293T cells treated with different concentrations of oxaliplatin for 48 h. b IP analysis demonstrating the post-translational modifications level of NFS1 in 293T cells treated with oxaliplatin (40 μM, 24 h), including phosphorylation (P-Thr/Ser), acetylation (Pan-Ace), and ubiquitination (Pan-ubi). c IP analysis showing the level of phosphorylated threonine (P-Thr) and serine (P-Ser) residues of NFS1 in 293T cells treated with oxaliplatin (40 μM, 24 h). d, e IP analysis demonstrating the serine phosphorylation level of NFS1 in cells overexpressing WT NFS1 or the S293A or S293D mutant of NFS1 in the absence (d) or presence of oxaliplatin (40 μM, 24 h) (e). f ACO1 activity analysis of NFS1 in control and NFS1-knockdown HCT116 cells when overexpressed rNFS1 WT and S293A or S293D mutant with oxaliplatin treatment (40 μM, 24 h). g–j ROS level (g), cell viability (h), YP1+ and PI+ cells (i), and lipid ROS levels (j) in HCT116 cells overexpressing rNFS1 WT and S293A or S293D mutant with or without oxaliplatin treatment (40 μM, 24 h). The bottom panel in (i) shows representative bright fields, and the red arrowheads indicate the large bubbles emerging from the plasma membrane, Scale bar = 100 μm. k Western blotting analysis of caspase-3, cleaved caspase-3, caspase-7, cleaved caspase-7, caspase-8, cleaved caspase-8, caspase-9, cleaved caspase-9, phosphorylated MLKL, total MLKL, GSDME, cleaved GSDME, and TFRC expression in HCT116 cells overexpressing rNFS1 WT or the S293A or S293D mutant in the absence or presence of oxaliplatin (40 μM, 24 h). l, m Statistical analysis of the tumor volumes (l) and weights (m) in nude mice after implantation of NFS1-knockdown HCT116 cells overexpressing rNFS1 WT or the S293A or S293D mutant, followed by an i.p. injection of oxaliplatin (7.5 mg/kg) (n = 5). Vinculin or flag was included as a loading control. The data in (f–h, j) are representative of three independent experiments, and those in (l, m) are representative of five independent experiments, and all are presented as the mean ± SD. The P values in (f–h, j, m) were calculated by one-way ANOVA, and those in (l) were calculated by two-way ANOVA with Tukey’s multiple comparisons test. **P < 0.01, ***P < 0.001

