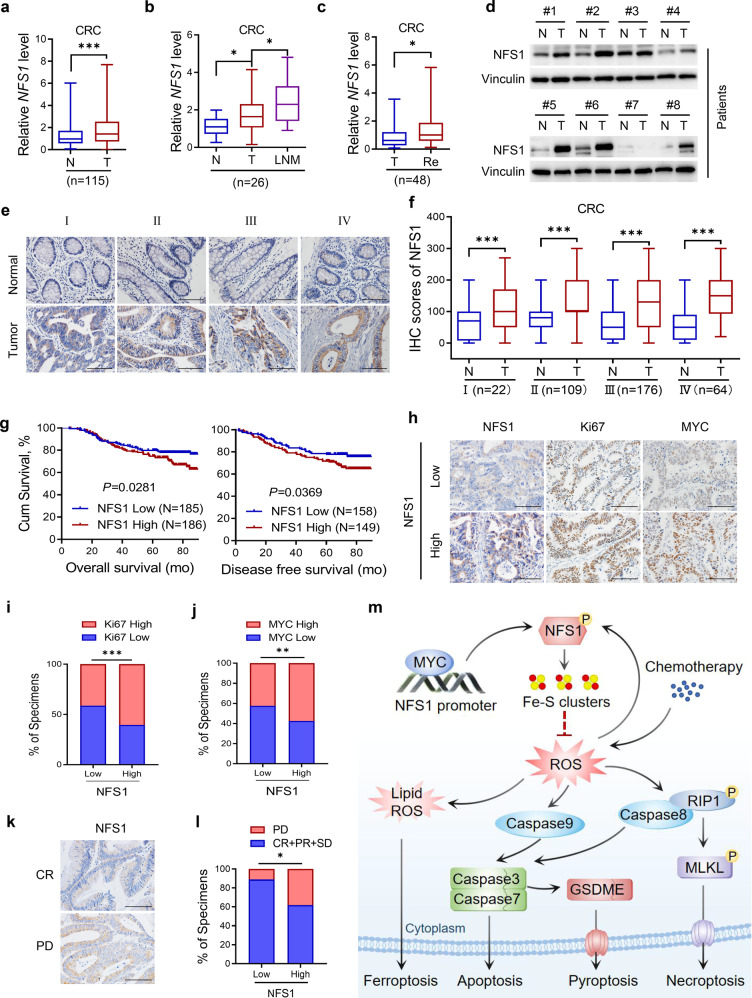
Fig. 7.
NFS1 is highly expressed in CRC and indicates poor prognosis. a–c Q-PCR detection of NFS1 mRNA expression in 115 pairs of primary CRC tumor tissues (T) and adjacent normal tissues (N) (a); 26 pairs of lymph-node metastases (LNM) (b); and 48 pairs of CRC tissues with recurrence (Re) and without recurrence (T) (c). d Western blotting analysis of NFS1 protein expression in eight pairs of CRC tumor tissues (T) and adjacent normal tissues (N). e, f Representative IHC staining images of NFS1. Scale bar = 100 μm (e); and IHC staining scores of NFS1 expression in paired primary CRC tumor tissues (T) and adjacent normal tissues (N) from patients at different cancer phases (phase I, n = 22; phase II, n = 109; phase III, n = 176; phase IV, n = 64) (f). All samples were obtained from SYSUCC. g Overall survival (left) and disease-free survival (right) assays of patients with CRC based on NFS1 protein level from (e, f). h Representative IHC staining images showing NFS1, Ki67, and MYC expression in CRC tumor tissues. Scale bar = 100 μm. i, j Correlations between NFS1 expression and Ki67 (i) and MYC (j) expression (n = 340). k Representative images showing NFS1 expression in patients with FOLFOX or XELOX chemotherapy. l Correlation between NFS1 expression with the response of patients with CRC to FOLFOX or XELOX chemotherapy (n = 61, PD progressive disease, SD stable disease, PR partial response, CR complete response). m Proposed working model based on this study. The model shows that phosphorylated NFS1 weakens platinum-based chemosensitivity by reducing the level of ROS to prevent PANoptosis. Vinculin was included as a loading control. The data in (a–c, f) are presented in the form of box and whisker plots (minimum–maximum) with the horizontal line in each box representing the median, and those in (i, j, l) are presented as the percentage of total samples. The P values in (a, c, f) were calculated by two-tailed paired Student’s t test, this in (b) was calculated by one-way ANOVA with Tukey’s multiple comparisons test, this in (g) was calculated by Kaplan–Meier analysis with the log-rank test, two-sided, and those in (i, j, l) were calculated by Pearson’s correlation analysis and chi-square test. *P < 0.05, **P < 0.01, ***P < 0.001

