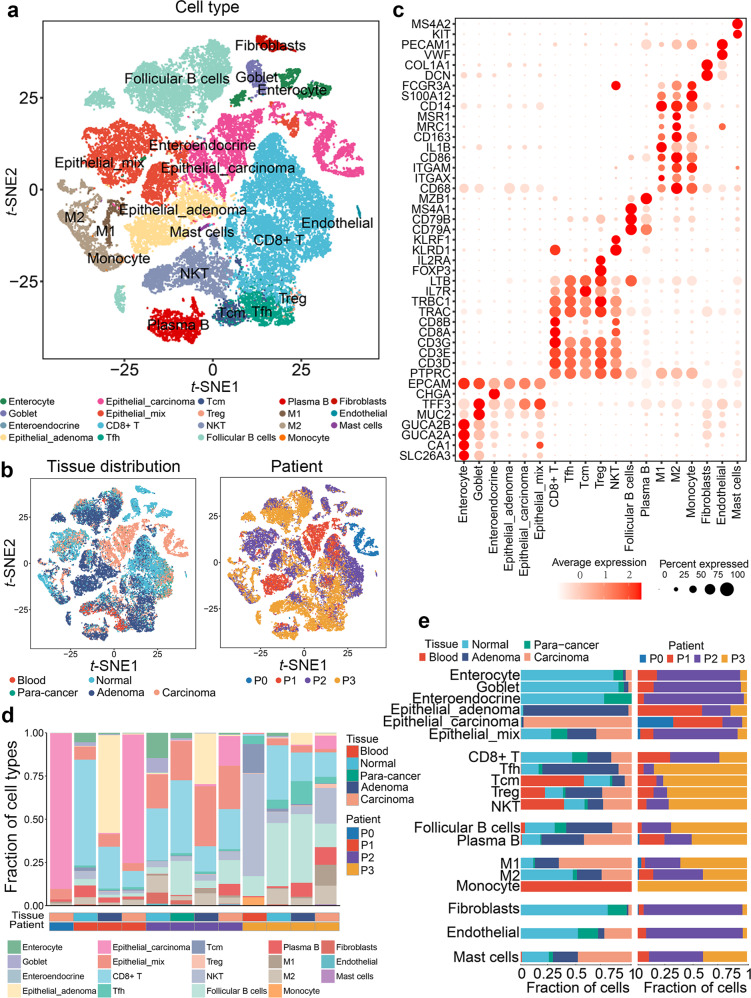
Fig. 2.
Cell type constitution of colorectal normal, para-cancer, adenoma, and carcinoma tissues. a t-SNE plots of cells from four patients (12 samples). Colors represent cell types. Cells were clustered into 19 sub-clusters based on biological annotation. Each dot represents a single cell. b t-SNE plots of tissue origin (left) and patient origin (right). Each dot represents a cell, and colors correspond to cell origins. c Log-normalized expression levels of canonical marker genes for the above 19 cell types. Circle size represents the percentage of cells that express the gene, and colors represent the average expression value within a cluster. d Bar plot showing the fraction of each cell type in 12 samples, with rows representing cell types and columns representing samples. e Bar plot presenting the fraction of tissue origin (left) and the fraction of patient origin (right) for the 19 cell types. Colors represent cell origins

