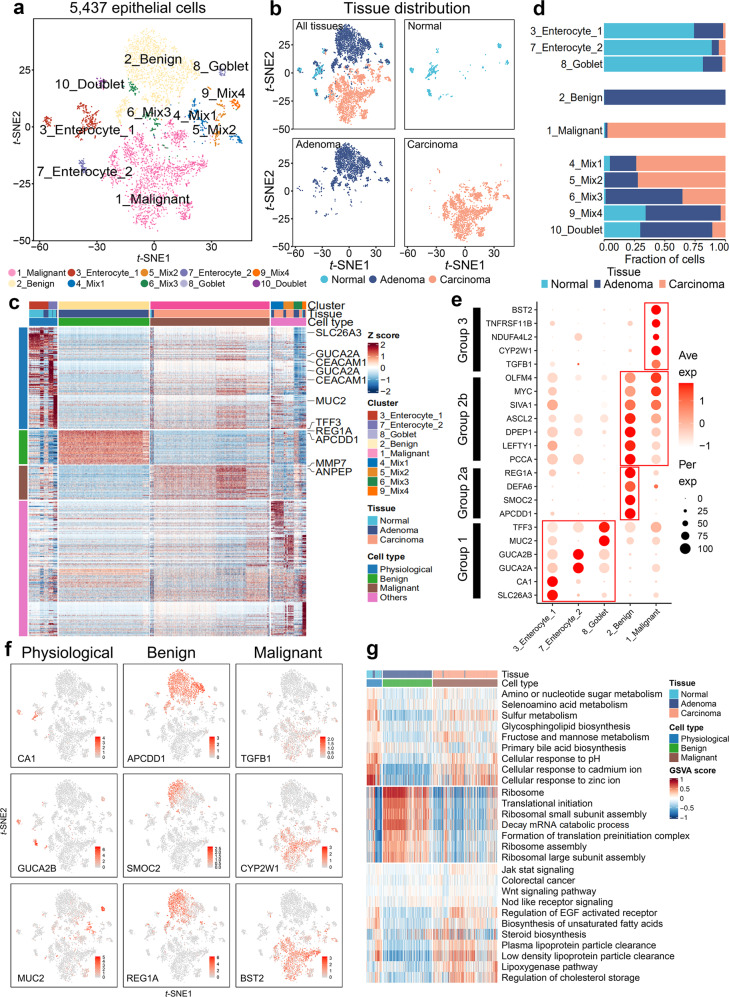
Fig. 3.
Three typical stages of epithelial cells during colorectal carcinogenesis and transcriptomic characterization. a t-SNE plot of 5,437 epithelial cells from P1 (3 samples). These cells were defined as 10 cell sub-clusters based on biological annotation and inferCNV analysis. Each dot represents a single cell, and colors correspond to cell types. b t-SNE plot of P1 epithelial cells and the three faceted t-SNE plots (normal, adenoma, and carcinoma). Colors represent the tissue origin of cells. c Top 50 differentially expressed marker genes in each cluster. Columns denote cells annotated with cell type, tissue, and cluster. Normal epithelial cell clusters (3_Enterocyte_1, 7_Enterocyte_2, and 8_goblet) were set as physiological cells. Rows indicate genes annotated with cell type and exemplar gene names, and colors represent Z-Score of log-normalized data. d Bar plot of tissue fraction in each cell sub-cluster. e Dot plot annotating physiological, benign, and malignant cell clusters by the expression of cluster-specific genes. Columns indicate cell sub-cluster. Circle size represents the percentage of cells that express the gene, and colors represent the average expression value within a cluster. f Expression of key marker genes in physiological (CA1, GUCA2B, MUC2), benign (APCDD1, SMOC2, REG1A), and malignant (TGFB1, CYP2W1, BST2) cells. Colors represent the log-normalized data. g GSVA results for physiological, benign, and malignant cells. Rows represent gene sets, and columns represent cells annotated with cell type and tissue. Colors indicate the GSVA score for each cell

