Fig. 5.
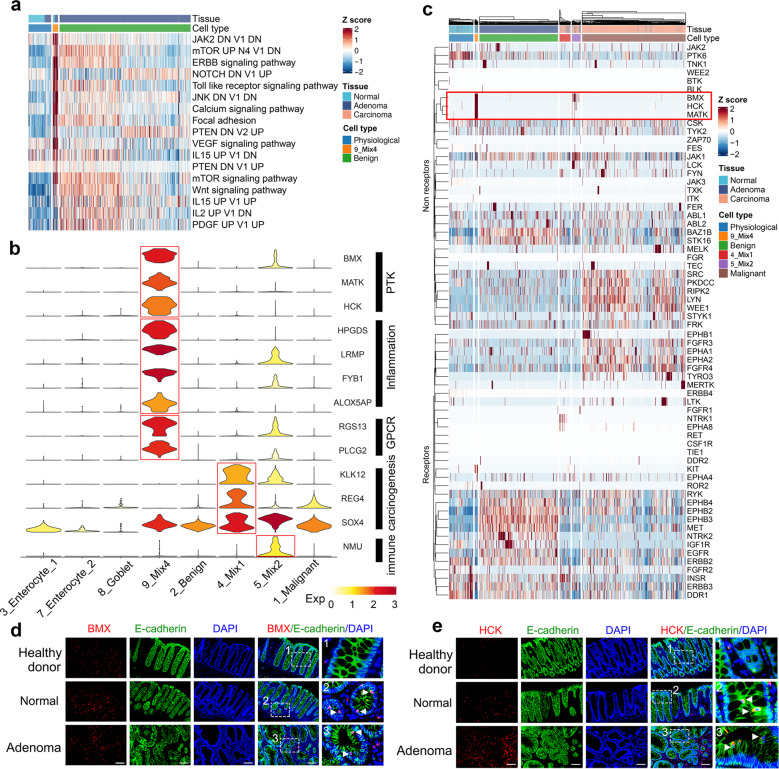
Protein tyrosine kinases drive adenoma initiation. a Signature scores for cells from physiological, adenoma-precursor (cluster 9_Mix4), and benign clusters. Columns represent cells annotated with cell type and tissue. Colors represent Z scores. DN, down; V1, version 1; V2, version 2. b Violin plot showing log-normalized expression levels of subset-specific genes in physiological (cluster 3, 7, and 8), benign, malignant, and intermediate populations (cluster 4, 5, and 9). Colors represent average expression levels within a cluster. c Hierarchically clustered heatmap showing the log-normalized expression levels of all expressed RTK/PTK genes in P1 epithelial cells. Columns represent cells annotated with cell type and tissue. Colors represent Z scores. d, e Co-immunofluorescence staining of E-cadherin with BMX (d) or HCK (e) was conducted for healthy donor colonic, CRC patient normal, and adenoma tissues. White arrows indicate positively stained epithelial cells. Scale bar, 100 μm

