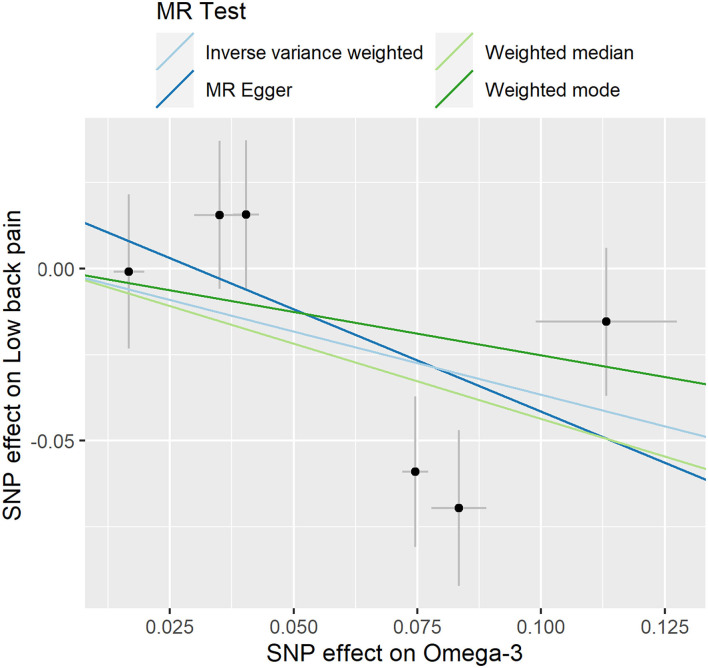
Figure 2.
Individual estimates about the putative causal effect of omega-3 on low back pain. The x-axis shows the single nucleotide polymorphism (SNP) effect and SE on each omega-3. The y-axis shows the SNP effect and SE on low back pain. The regression line for MR Egger, Weighted median, inverse variance weighted (IVW), Simple mode, and Weighted mode is shown.

