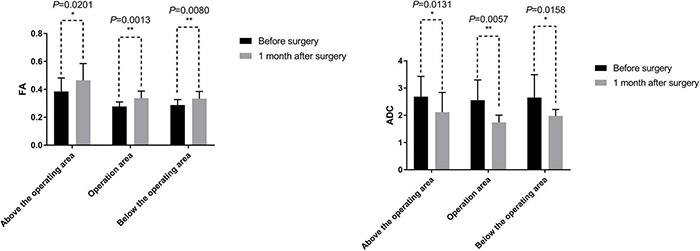
FIGURE 9.

DTI related measurements include fractional anisotropy (FA) and apparent diffusion coefficient (ADC). The mean values of FA at 1 month after the surgery were greater than before the surgery. The difference of FA values before and 1 month after the surgery was statistically significant by a paired sample t-test (p < 0.05). The mean values of ADC at 1 month after the surgery were less than that before the surgery. The difference of ADC values before and 1 month after the surgery was statistically significant by a paired sample t-test (p < 0.05). *, 0.01 < p < 0.05; **, p < 0.01.
