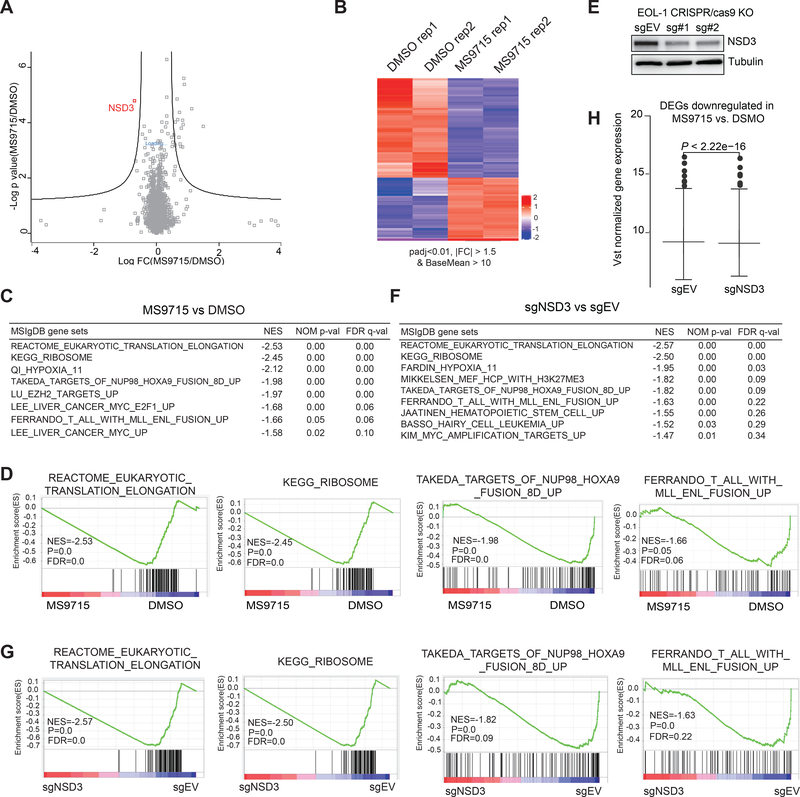
Figure 4. Omics studies show that MS9715 selectively degrades NSD3 in cells, leading to suppression of the NSD3-related gene-expression program.
(A) Quantitative proteomics results showing relative abundance of proteins in EOL-1 cells treated with DMSO or 2.5 μM of MS9715 for 30 hours. Each dot in the plot represents one of a total of 5,452 proteins detected among all samples (n=3 biologically independent samples per group measured in a single 10-plex tandem mass tag [TMT] experiment), with x-axis and y-axis showing log transformed value of fold-change in expression and P value, respectively. Black lines were calculated using a false discovery rate of 5% and a hyperbolic curve threshold of S0 value of 0.15 using the Perseus software. See also Table S1. The method for calculating P value is described in STAR Methods section.
(B) Heatmap showing the relative expression levels of differentially expressed genes (DEGs) after a 4-day treatment with 2.5 μM of MS9715, relative to DMSO, in EOL-1 cells (n=2 biologically independent replicates [Rep] per group, i.e., Rep 1 and 2). Threshold of DEG is set at the adjusted DESeq P value (padj) less than 0.01 and fold-change (FC) over 1.5 for transcripts with mean tag counts of at least 10. The Wald test is used for calculating DESeq2 P value and Benjamin-Hochberg method for calculating padj value, See also Table S2.
(C) Summary of GSEA results showing correlation between the indicated gene signatures and MS9715 treatment in EOL-1 cells. The method for calculating P and FDR values in GSEA results is described in STAR Methods section.
(D) GSEA revealing that, relative to DMSO, MS9715 treatment is positively correlated with downregulation of the indicated gene sets related to translation elongation and ribosome activity or those activated in hematopoietic cancer due to the NUP98-HOXA9 or MLL-ENL oncogene.
(E) Immunoblotting for NSD3 after a four-day induction of Cas9 in the EOL-1 cells stably transduced with either empty vector (sgEV) or an NSD3-targeting sgRNA (sg#1 or sg#2).
(F) Summary of GSEA results showing correlation between the indicated gene signatures and NSD3 KO in EOL-1 cells. See also Figure S2 and Table S3.
(G) GSEA revealing that, relative to control (sgEV), the CRISPR/Cas9-mediated NSD3 KO is positively correlated with downregulation of the indicated gene sets related to translation elongation and ribosome activity or those activated in hematopoietic cancer due to the NUP98-HOXA9 or MLL-ENL oncogene.
(H) Box plot showing overall expression of the MS9715-downregulated DEGs (as defined in panel B) in EOL-1 cells after a four-day induction of Cas9 for NSD3 depletion (sg#1 as sgNSD3; right) or mock treatment (sgEV; left). A paired t-test was applied to compare the mean of normalized expression between the two treatment groups.

