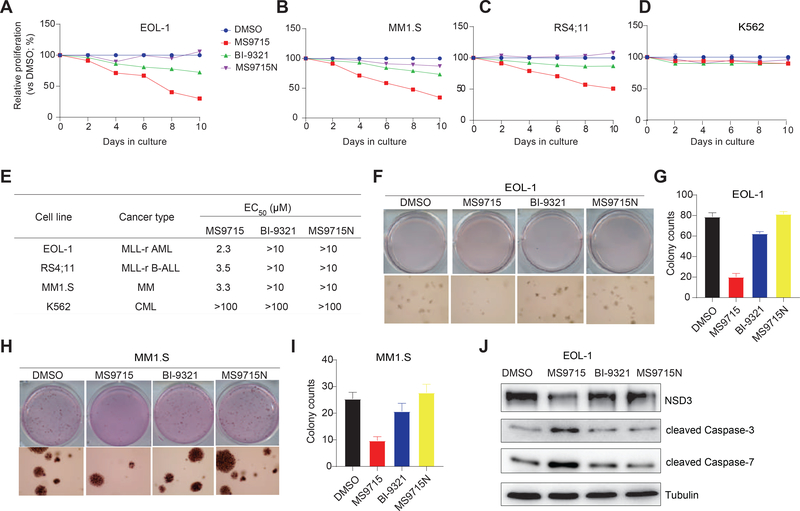
Figure 6. MS9715, but not BI-9321, effectively inhibits cancer cell proliferation and colony formation.
(A-D) The growth inhibitory activity of MS9715 (2.5 μM) was assessed in EOL-1 (A), MM1.S (B), RS4;11 (C) and K562 (D) cells, compared to DMSO, BI-9321 (2.5 μM) and MS9715N (2.5 μM). Cells were treated for ten days. Y-axis shows average ± SD of three independent experiments after normalization to DMSO-treated.
(E) Summary of EC50 values of MS9715, MS9715N and BI-9321 in the indicated cell lines after an eight-day treatment. EC50 values are the means of three independent experiments. CML, chronic myelogenous leukemia. See also Figure S4.
(F-I) Representative cell plate scan images (F and H) and quantifications of colony formation (G and I) using EOL-1 (F-G) or MM1.S cells (H-I) treated with DMSO or 2.5 μM of MS9715, BI-9321 or MS9715N. Colony numbers are presented in average ± SD of two independent experiments.
(J) Immunoblotting for the indicated apoptotic markers after a four-day treatment of EOL-1 cells with DMSO or 2.5 μM of MS9715, BI-9321 or MS9715N.

