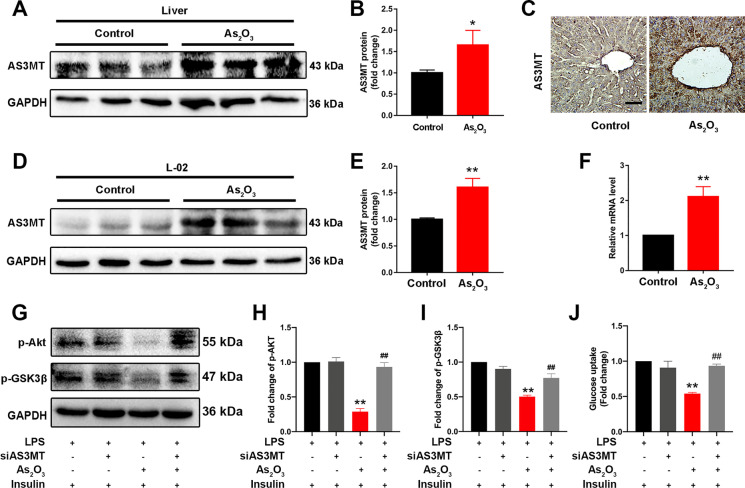
Fig. 3.
AS3MT is associated with iAs-induced hepatic IR. (A–B) AS3MT expression in control and iAs-treated livers. GAPDH served as a loading control. (C) AS3MT expression by immunohistochemistry in control and iAs-treated livers. (D–E) AS3MT expression in iAs-treated L-02 cells. GAPDH served as a loading control. (F) Relative Pck1 and G6pc mRNA levels in livers from indicated groups. (G–J) Total and phosphorylated AKT and GSK3β expression levels (G-I) and glucose uptake (J) in iAs-treated L-02 cells, with or without siAS3MT transfection. *P < 0.05 and **P < 0.01 versus the control group, ##P < 0.01 versus the iAs-treated group. The data represent the mean ± standard error of the mean (SEM), n = 3. Scale bar = 100 μm. Statistical significance was determined by Student two-tailed t tests (A–F) and one-way ANOVA (G–J)

