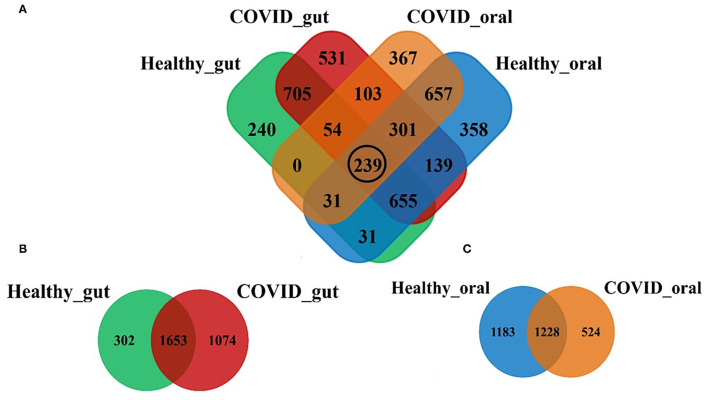
Figure 1.
Distribution of shared and unique operational taxonomic units (OTUs) in the gut and oral wash of healthy controls and COVID-19 cases. (A) Venn diagram showing the overview of common and unique OTUs among four groups of samples. The black circle indicates the number of OTUs shared to all groups. (B,C) Represents the distribution of OTUs between healthy and COVID-gut, and healthy and COVID-oral samples, respectively.

