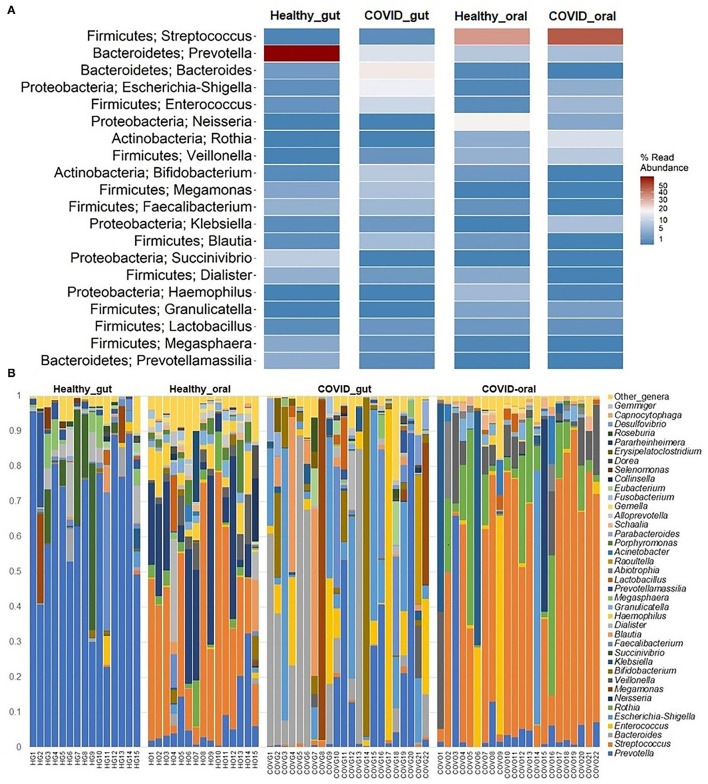
Figure 5.
The taxonomic abundance of bacteria in the gut and oral wash of healthy controls and COVID-19 cases. (A) Heatmap showing top 20 bacterial genera along with their corresponding phyla in the four sample groups. The color bar represents the abundance value (%) of each genus ranging from 1 (lowest abundance; expressed in dark blue color) to 100 (highest abundance; expressed in brick red color) in the corresponding sample group. (B) Relative abundance of 39 bacterial genera in the gut and oral samples of healthy control and patients with COVID-19. The abundance is sorted from bottom to top by the decreasing pattern of bacteria with the remaining genera kept as “other genera.” Each stacked bar represents the abundance of bacterial genera in each sample of the corresponding category.

