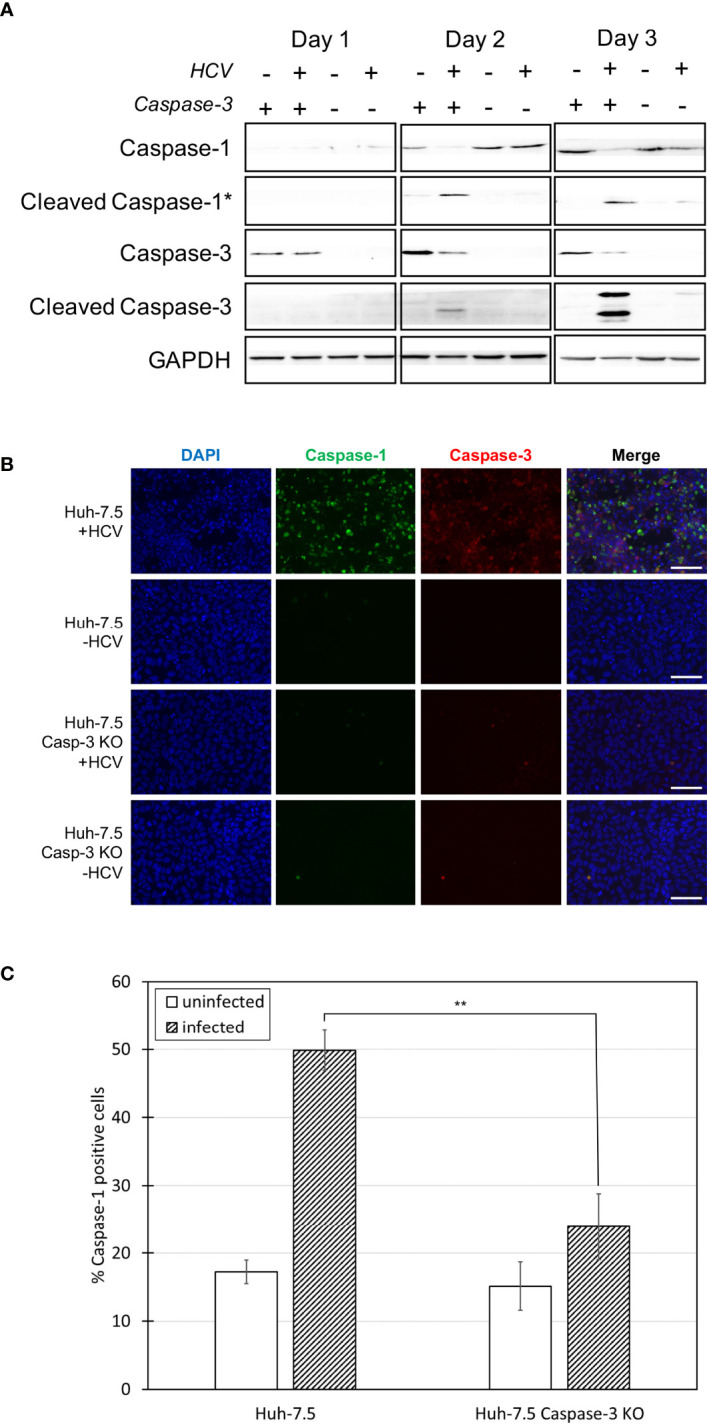
Figure 4.

Comparison of caspase levels when apoptosis is inhibited. Huh-7.5 cells or Huh-7.5 caspase-3 KO cells were infected with HCV at MOI = 1 or left uninfected. (A) At 1, 2, and 3 days p.i., cells and culture fluids were harvested for Western Blot analysis. Membranes were probed for pro-caspase-1, cleaved-caspase-1, pro-caspase-3, cleaved-caspase-3, and GAPDH. * indicates samples from cell culture fluids rather than cell lysates. (B) At 3 days p.i., cells were stained using a probe specific for cleaved caspase-1 (green), then fixed using acetone. Cells were subsequently stained using a specific antibody for cleaved caspase-3 (red). Nuclei were stained with DAPI (blue) and analysis was by fluorescence microscopy. Scale bar, 100 μm (C) At day 4 p.i., cells were stained for cleaved caspase-1 using a specific probe and fixed using fixative from the caspase-1 probe kit. Cells were run on a CytoFLEX flow cytometer and data were analyzed using Kaluza analysis software and presented as the percent of total cells positive for caspase-1. Data from caspase-3 KO cells are compared here to data from wild-type cells found in Figure 1D . **p < 0.005. (A–C) Data are representative of three independent experiments.
