
FIGURE 1.
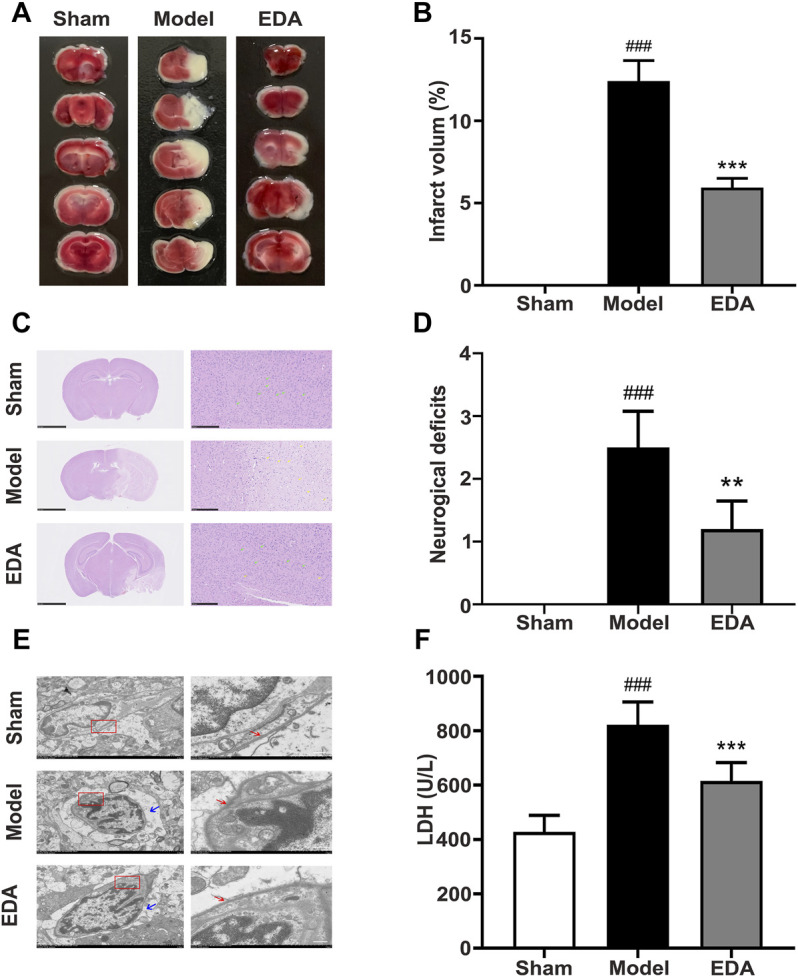
EDA protects against cerebral I/R injury and endothelial injury. Mice were subjected to 1 h of ischemia, followed by 24 h of reperfusion. EDA (3 mg/kg) was administered intraperitoneally after ischemia. (A) Representative TTC-stained brain sections. (B) Quantitative analysis of infarct volume. (C) Stained H&E sections of mice brains. Shrunken cells with pyknotic nuclei are indicated with yellow arrows, while intact cells are indicated with green arrows. (D) Neurological deficit scores in different groups. (E) The structure and morphology of cerebral microvascular endothelial cells in different groups were examined by electron microscopy. Red arrow: brain microvascular endothelial cell membrane. Blue arrow: the degree of edema around brain microvascular endothelial cells. (F) LDH activity. All data are presented as the means ± SEM, n = 6. Scale bar = 50 μm. # p < .05, ## p < .01, ### p < .001, vs. Sham group, *p < .05, **p < .01, ***p < .001, vs. MCAO/R group.