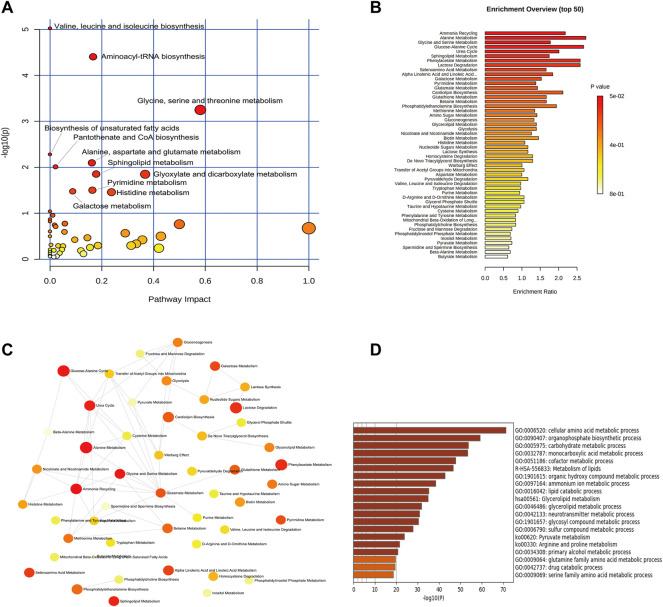
FIGURE 4.
Enrichment analysis of metabolic pathway and related regulatory enzymes. (A) Bubble plots of altered metabolic pathways. (B) Overview of biological function related to the differential endogenous metabolites. (C) Network map of pathways. (D) Regulatory enzyme GO enrichment analysis results.

