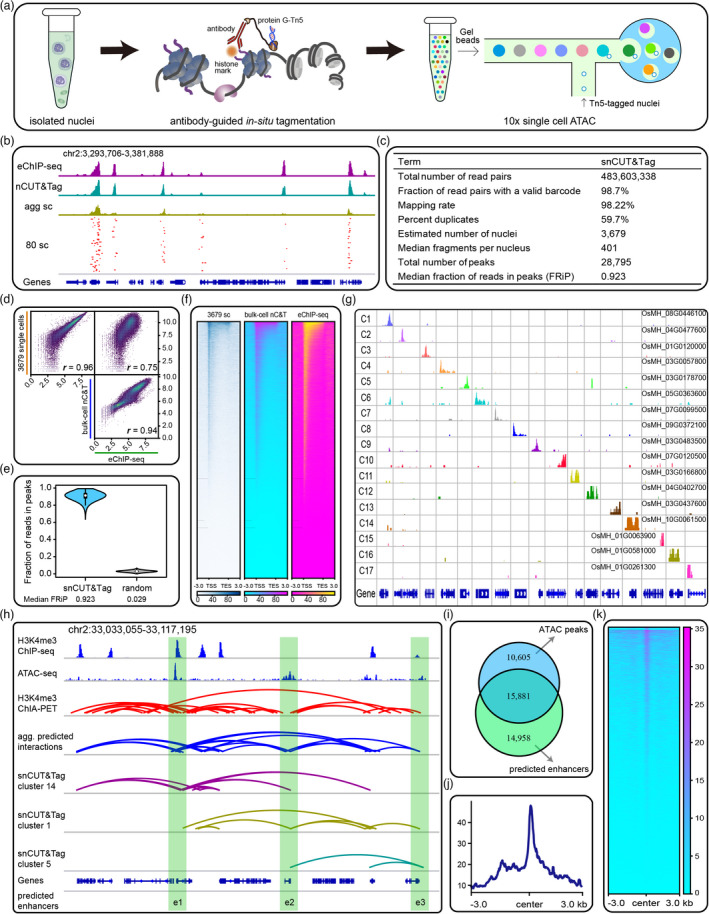
Figure 1.

snCUT&Tag profiles histone modification at single‐cell resolution in rice. (a) Schematics of single‐nucleus CUT&Tag workflow. (b) Representative H3K4me3 landscapes generated by indicated methods. Profiles of 3679 aggregate single nuclei (agg sc) and 80 selected single nuclei (80 sc) are presented. The genomic region contains 16 genes with gene IDs from OsMH_02G0056600 to OsMH_02G0058100. (c) Summary of the snCUT&Tag data. (d) Scatterplots showing Spearman correlations among snCUT&Tag, nCUT&Tag (nC&T), and eChIP‐seq. (e) Violin plot showing FRiP scores of the snCUT&Tag data. Simulated random profiles are presented as control. (f) Heatmaps showing H3K4me3 peak signals across gene bodies. (g) Genomic screenshots showing aggregate marker peaks for 17 clusters (C1−C17). The genes IDs that annotated by marker peaks are presented in every row of the cell clusters. (h) Genomic screenshot showing the predicted enhancer–promoter interactions in indicated cell clusters and aggregate single cells (agg. predicted interactions). The green boxes indicate predicted enhancers (e1−e3). (i) Venn diagram showing overlapping of the predicted enhancers and the ATAC‐seq peaks. (j–k) Density profiles and heatmaps showing enrichment of ATAC‐seq signals around the predicted enhancers.
