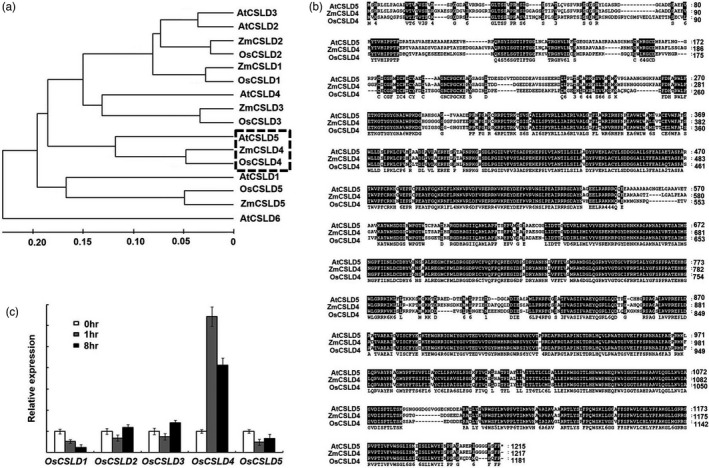
Figure 1.

Phylogenetic analysis of OsCSLD4 homologous proteins and OsCSLD4 salt‐induced expression patterns. (a) Phylogenetic analysis of OsCSLD4 homologous proteins in Arabidopsis, maize and rice. (b) Alignment of amino acid sequences of AtCSLD5, ZmCSLD4 and OsCSLD4. White or black background represents the identity of amino acid sequences. (c) Expression level of rice OsCSLD subfamily genes under salt treatment (150 mm NaCl). The genes expression level under normal condition (0 h) is standardized to ‘1’. Figure shows the relative expression level of genes under salt treatment to normal condition. The figure presents the average from three independent experiments. Bar represents the standard error (±SE).
