Figure 4.

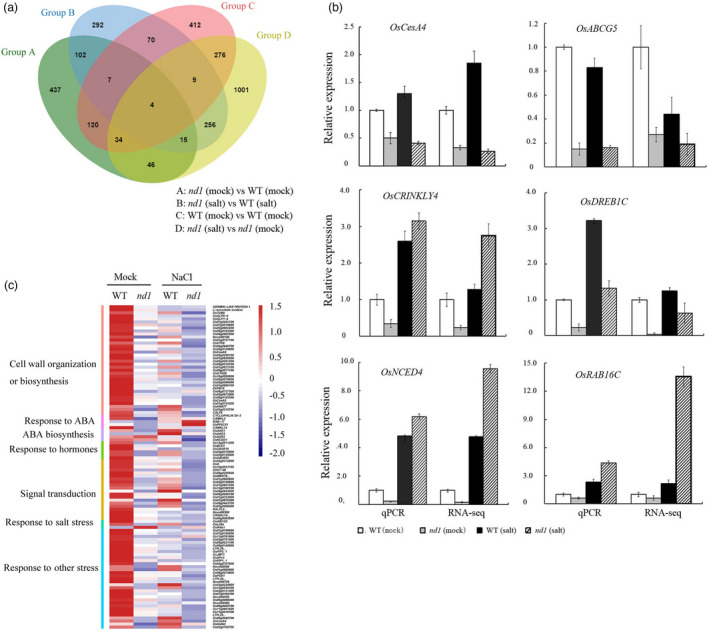
Global transcriptome analysis of OsCSLD4‐dependent genes associated with salt stress in rice. (a) Venn diagram of DEGs between WT (Zhongxian 3037) and nd1 under the two different experimental conditions. (b) Numbers of differentially expressed genes (DEGs) between WT and nd1 under the two different treatment conditions (P < 0.05). Red bars indicate down‐regulated DEGs in nd1; green bars indicate up‐regulated DEGs in nd1. (c) Hierarchical clustering and expression levels of OsCSLD4‐dependent DEGs that respond to NaCl treatment or are unresponsive. Coloured boxes on the right indicate GO terms that are statistically significantly enriched within each gene cluster. (d) Verification of the relative expression in response to different treatments of some OsCSLD4‐independent differentially expressed genes by qRT‐PCR and RNA‐seq respectively. The expression level of genes in WT under normal conditions is standardized to ‘1’. The expression level of OsCSLD4 is presented as the relative level to that of WT under normal condition.
