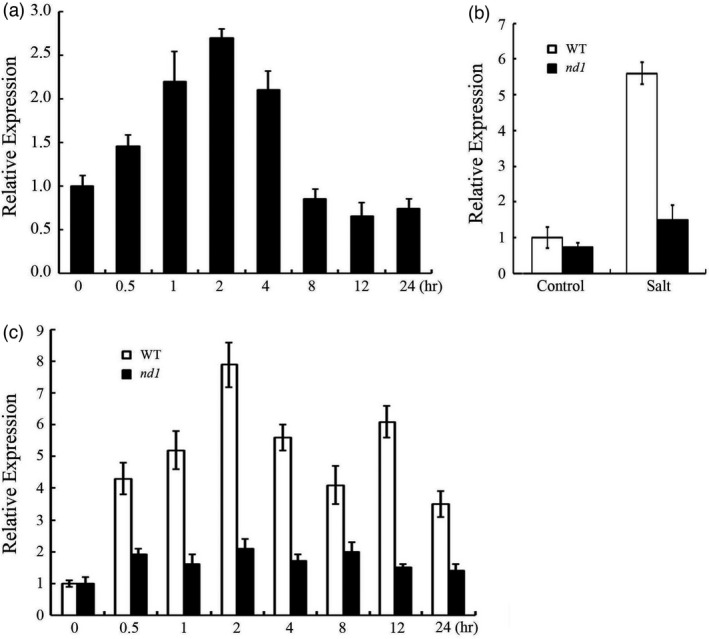
Figure 7.

Salt‐induced expression of OsCSLD4 is independent of ABA. (a) Expression pattern of OsCSLD4 under ABA treatment. The OsCSLD4 expression level under normal condition (0 h) is standardized to ‘1’. The figure presents the relative expression level of OsCSLD4 under ABA treatment compared to that under normal condition. (b) Expression level of OsCSLD4 in nd1 under salt treatment. The OsCSLD4 expression level in WT under normal condition is standardized to ‘1’. The expression level of OsCSLD4 was provided as the relative level to that in WT under normal conditions. (c) Expression pattern of OsCSLD4 under treatments with salt and ABA. The expression level of OsCSLD4 under normal condition (0 h) is standardized to ‘1’. The figure presents the relative expression level of OsCSLD4 under salt and ABA treatment to that under normal conditions (0 h). The expression of OsActin1 was used as the internal control. The figure presents the average of at least three independent experiments. Bars represent the SE (±).
