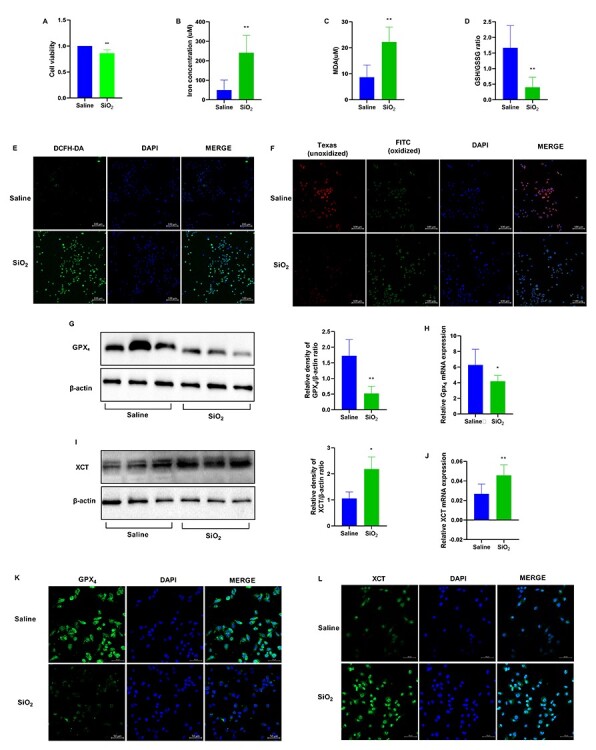
Figure 3.

SiO2 induces ferroptosis in RAW264.7 cells. RAW264.7 cells were treated with saline or SiO2 suspension at 50 μg/cm2 for 24 h. n = 3 per group. (A) Cell viability of RAW264.7 cells detected with CCK-8 assay. (B) Iron concentration in RAW264.7 cells in the indicated groups. (C) Malondialdehyde (MDA) levels and (D) The glutathione/glutathione oxidized (GSH/GSSG) assay. (E) Reactive oxygen species (ROS) was observed using DCFH-DA. Scale bars, 100 μm. (F) Lipid peroxidation was measured using the C11-BODIPY581/591 probe. Scale bars, 100 μm. Western blotting and quantification of the (G) GPX4 and (I) XCT proteins in RAW264.7 cells in the saline and SiO2 groups. mRNA expression of (H) GPX4 and (J) XCT in RAW264.7 cells in the saline and SiO2 groups. Representative images of RAW264.7 cells showing the expression of (K) GPX4 and (L) XCT. Scale bars, 50 μm. *P < 0.05 vs. saline group; **P < 0.01 vs. saline group.
