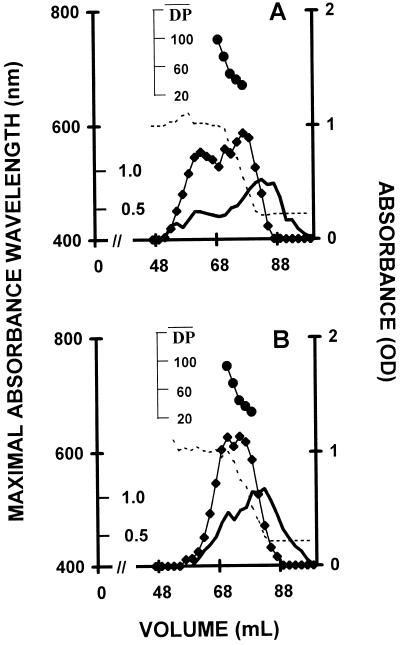
Figure 7.
Average chain length distribution of wild-type and mutant amylopectins. A and B, Average chain length distributions of amylopectin purified from a sta8-1 (strain BafV13) and wild-type (strain 330) after debranching by P. amyloderamosa isoamylase. Ten milligrams of purified amylopectins were loaded on a TSK-HW-50(F) GPC column. The optical density (♦) of the iodine-polysaccharide complex was measured for each 2-mL fraction at λmax. The optical density scale is on the right y axis. The amount (milligrams) of Glc for the whole 2-mL fractions is scaled on the inner side of the left y axis. The outer y axis on the left represents the λmax wavelength scale (in nanometers). The x axis shows the elution volume scale (in milliliters). λmax values are displayed for all fractions for which it could be determined (broken line). The DP scale (●) was generating by using the λmax values of the debranched glucans as internal standards according to Banks et al. (1971).

