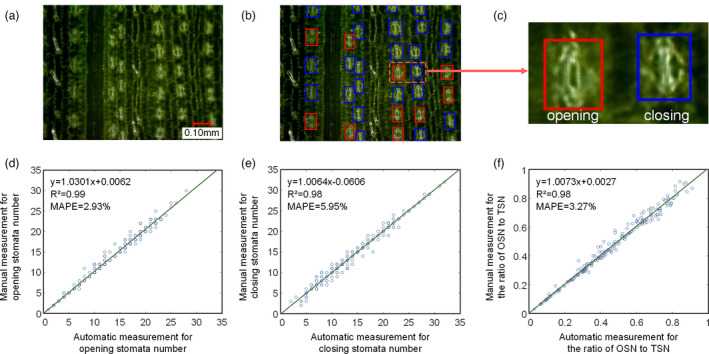
Figure 3.

Results of stomata detection based on the dual‐object detection model. (a) The original image. (b) The stomata detection results, where the red box is for opening stomata and the blue box is for closing stomata. (c) An opening stoma and a closing stoma. (d–f) The scatter plots of the automatic measurement versus manual measurement of the number of opening stomata (d), number of closing stomata (e) and the ratio of opening stomata number to total stomata number (f).
