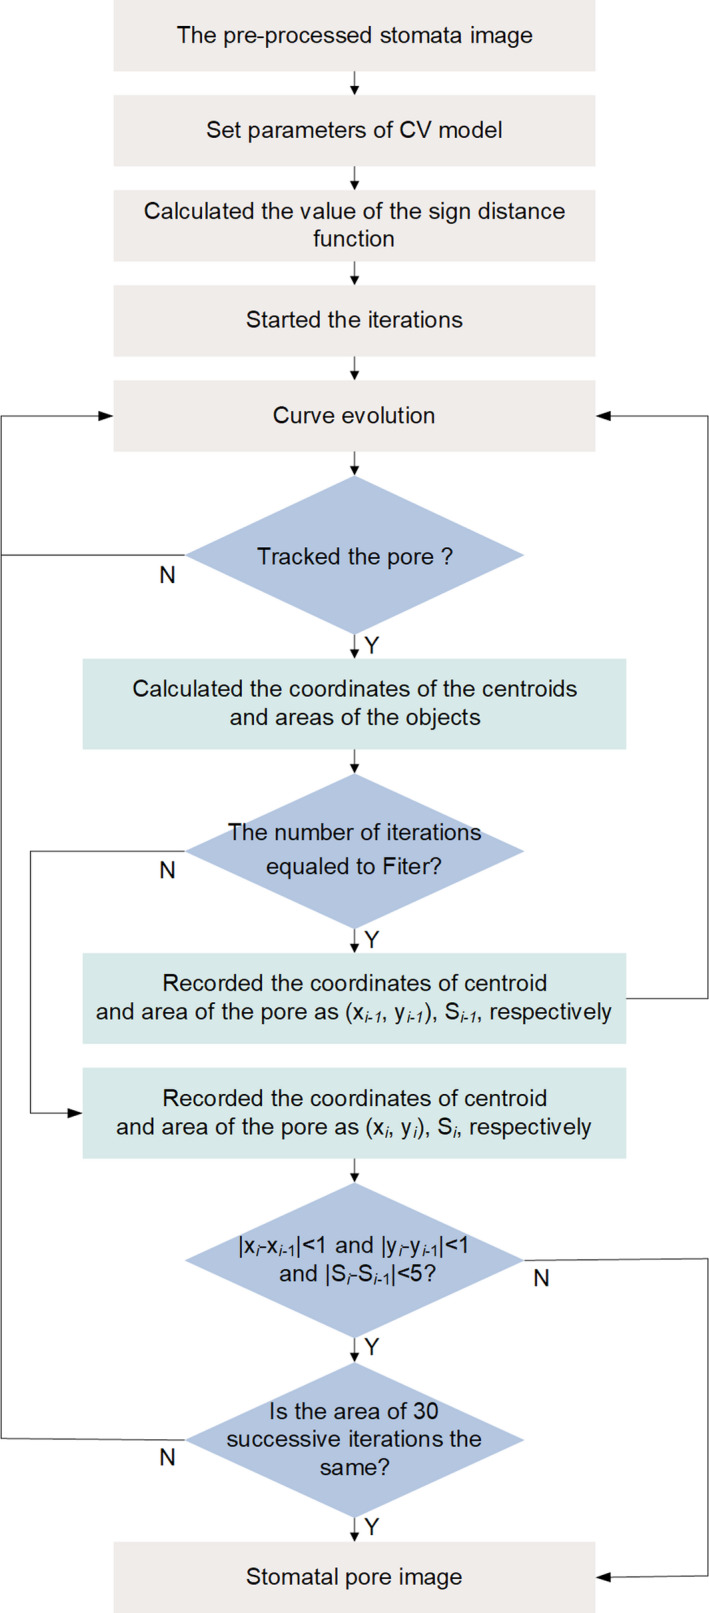
Figure 12.

Flow chart of the improved CV model. (x i ‐1, y i ‐1) and S i ‐1 are the coordinates and area of pores of the (i‐1)‐th iteration respectively. (x i , y i ) and S i are the coordinates and area of pores of the i‐th iteration respectively. ‘Fiter’ is the number of iterations required before pore tracking commences, which here is 10.
