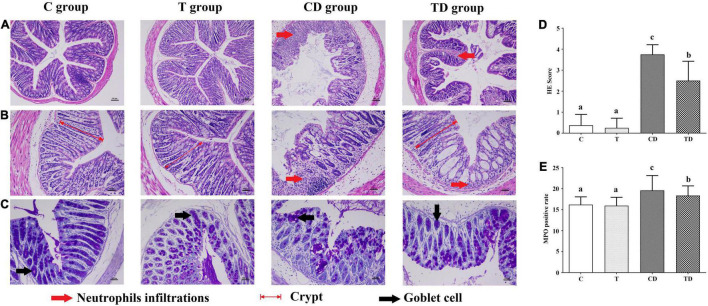
FIGURE 2.
Histopathological analysis of colon segments. (A,B) Staining of colon tissues of mice with hematoxylin–eosin (H&E), original magnifications of × 100 (A) and × 200 (B). (C) Goblet cells observed with Alcian blue/periodic acid–Schiff (AB/PAS) staining. (D) Determination of the histological scores for the control (C), dextran sodium sulfate (DSS) model (CD), and Tibetan tea + DSS (TD) groups. (E) Sections immunostained with mouse anti-myeloperoxidase (MPO) antibody in each group, with the positive cells staining brown. The positive rate of MPO cells (the number of positive cells/total cell number × 100) was calculated using HALO. Lowercase letters a–c indicate significant differences in all treatment groups (p < 0.05).

