
Figure 1.
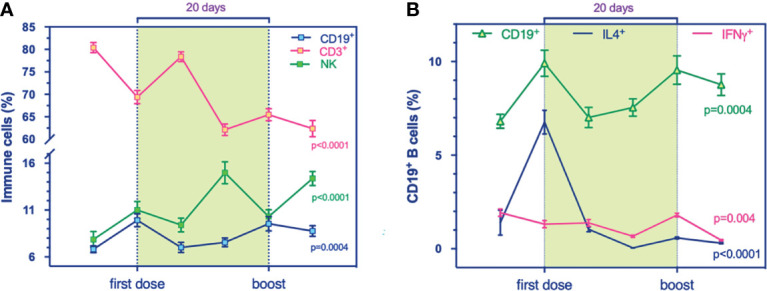
Global landscape of the immune phenotypic changes in a longitudinal cohort who received mRNA-based vaccination against SARS-CoV-2. (A, B) Flow cytometry analysis for immune cell compartments panel. (A) prevalence % of total T (CD3+, purple, p < 0.0001), B (CD19+, blue, p = 0.0004), and NK (CD56+, green, p < 0.0001) cells during the timing vaccination. (B) Prevalence % of IL4+-producing B cells (blue, p < 0.0001) and IFNγ+-producing B cells (purple, p = 0.004) compared to total B cells (green, p = 0.0004) at the stages of immunization. Multivariable mixed models for repeated measures adjusted for confounders (time, age, sex, responders) were performed.