
Figure 2.
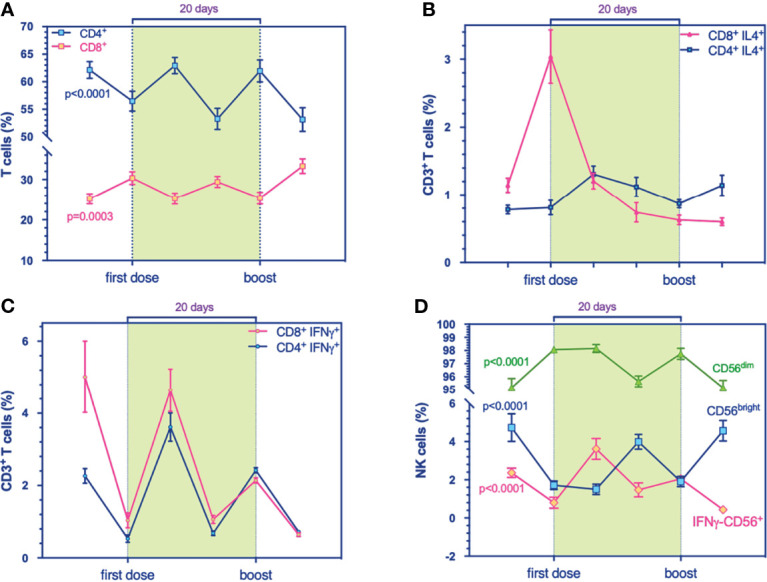
Flow cytometry analysis for immune cell compartments panel. (A) Prevalence % of CD4+ (blue, p < 0.0001) and CD8+ T cells (purple, p = 0.0003). (B) Prevalence % of IL4+-producing-CD4+ (blue) and -CD8+ T cells (purple), respectively. (C) Prevalence % of IFNγ+-producing-CD4+ (blue) and -CD8+ T cells (purple), respectively. (D) Prevalence % of IFNγ+-producing NK cells (purple, p < 0.0001), CD56dim (green, p < 0.0001), and CD56bright (blue, p < 0.0001) during the timing. Multivariable mixed models for repeated measures adjusted for confounders (time, age, sex, responders) were performed.