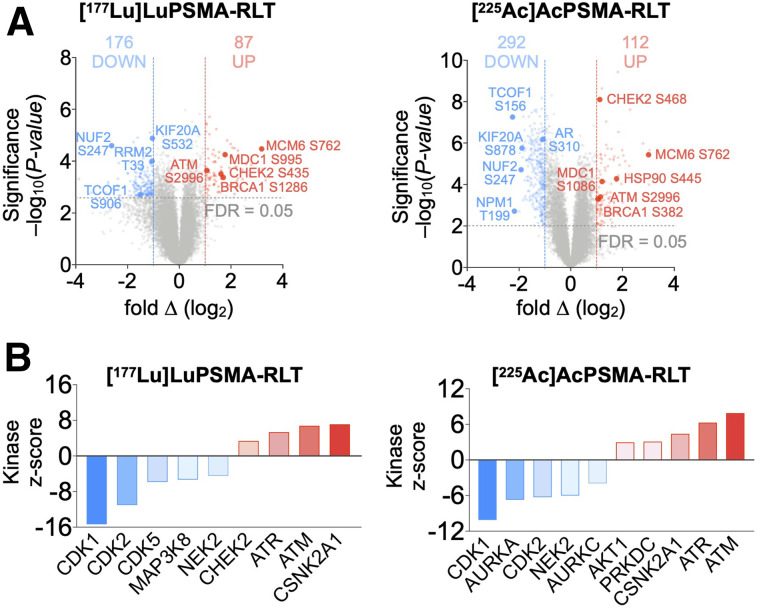
FIGURE 3.
Phosphoproteomic analyses of PCa tumors reveal PSMA RLT–induced alterations. (A) Volcano plots of identified phosphopeptides (512 significant phosphopeptides for [177Lu]Lu-PSMA RLT and 405 for [225Ac]Ac-PSMA RLT). (B) Kinase-substrate enrichment analysis identifying kinases with at least 5 substrates. Graphs represent data from 3 tumors per group for [177Lu]Lu-PSMA RLT and 5 tumors per group for [225Ac]Ac-PSMA RLT. FDR = false-discovery rate.

