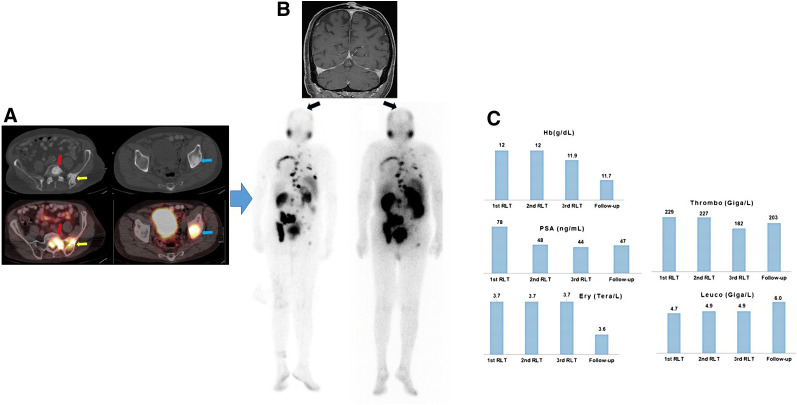
FIGURE 2.
Patient 1. (A) Axial CT (top) and PET/CT (bottom) images. Intense 18F DCFPyL uptake by osteoblastic bone lesions in first sacral vertebra (red arrow), left iliac bone/iliosacral joint (yellow arrow), and left acetabulum (blue arrow) is seen on PET/CT. (B) Coronal MRI. T1-weighted sequence at start of first RLT shows squamous cell carcinoma in parietal region of skull; this lesion showed no PSMA uptake on posttherapy scans. The 2 images below MR image are posttherapy 177Lu-PSMA scans after first therapy cycle (left) and after third therapy cycle (right). (C) Sequential lab tests showed PSA decline from 78 to 47 ng/mL but no substantial changes in hematologic parameters. Ery = erythrocyte; thrombo = thrombocyte; Hb = hemoglobin; leuco = leukocyte.

