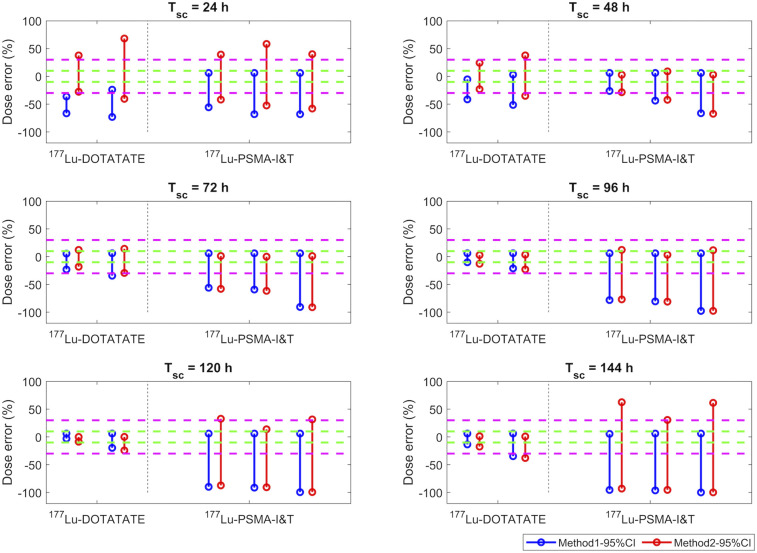
FIGURE 4.
DEs (%) of tumor doses estimated using method 1 (blue) and method 2 (red) when patient Teff is within 95% CI range from Table 2. Green and magenta dashed lines indicate ±10% and ±30% of DEs, respectively. Data in 177Lu-DOTATATE column correspond to studies 3 and 4, whereas data in 177Lu-PSMA-I&T column correspond to bone and lymph node metastasis data from studies 8 and 9.

