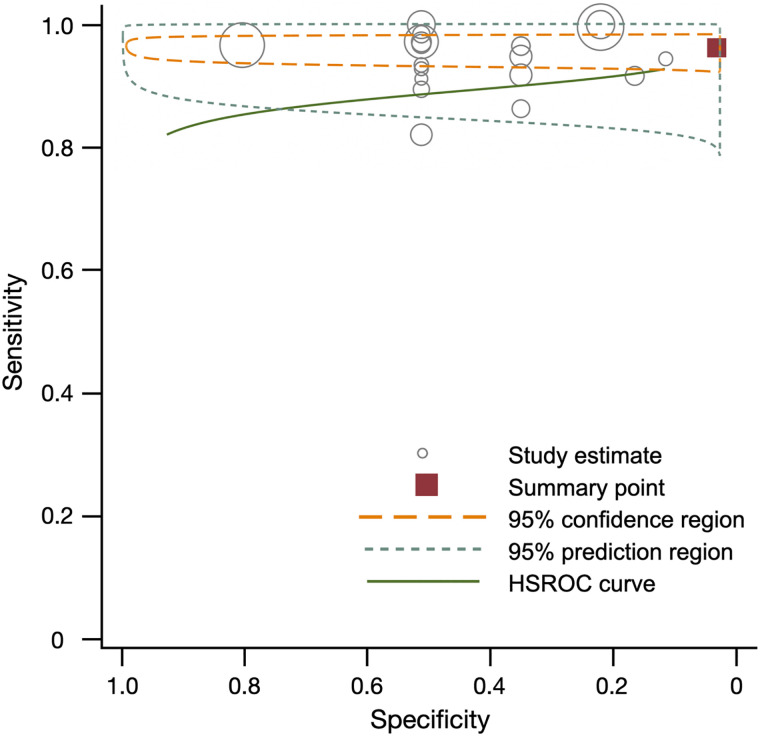
FIGURE 2.
Summary of sensitivity, specificity, and hierarchic summary receiver-operating-characteristic (HSROC) plot of sensitivity and specificity for 18F-FCH vs. pathology overall. Effect sizes for sensitivity and specificity were 0.97 (95% CI, 0.96–0.98) and 0.23 (95% CI, 0.11–0.35), respectively. Size of circles represents size of individual studies.

