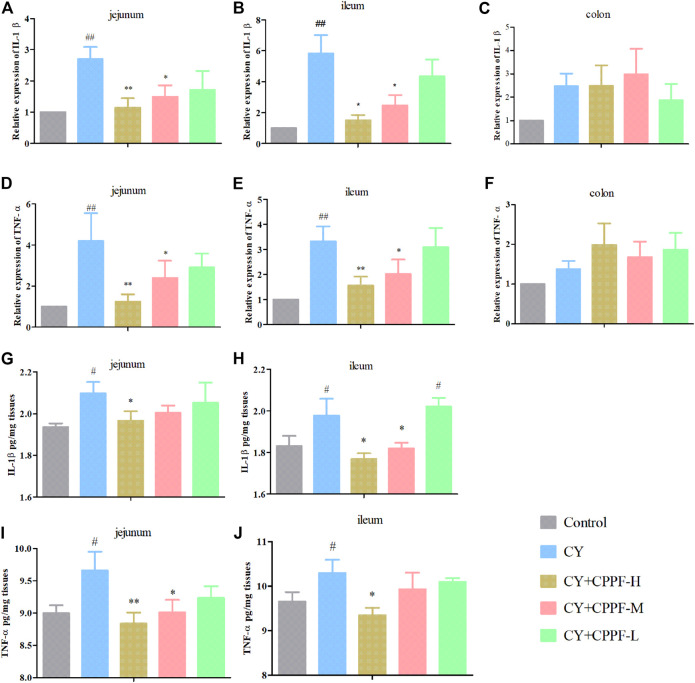
FIGURE 2.
The effect of CPPF on IL-1β (A–C,G,H) and TNF-α (D–F,I,J) mRNA and protein expression in different parts of intestine tissue; * indicated significant difference compared with CY group, p < 0.05; ** indicated significant difference compared with CY group, p < 0.01; ## indicated significant difference compared with Control group, p < 0.01; # indicated significant difference compared with Control group, p < 0.05, n = 12.

