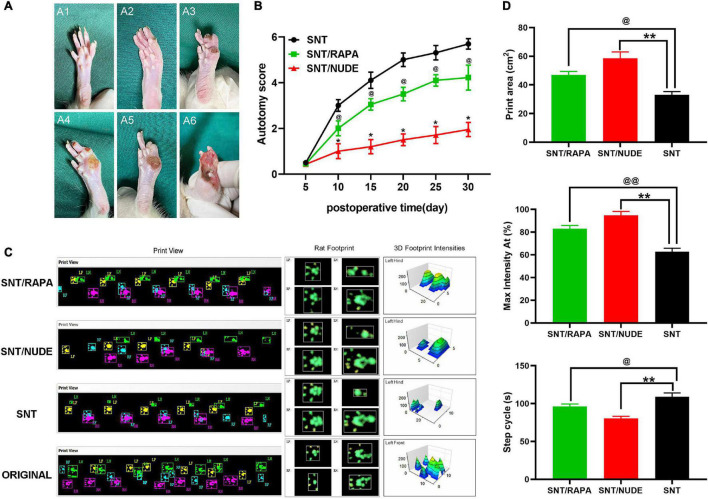
FIGURE 3.
Scoring results of autotomy behavior and gait observation and analysis. (A) Modified Wall’s score for rats. No autotomy (score 0) (A1); loss of half of the second toe (score 1) (A2); loss of the first and the third toes (score 1) or complete loss of the second toe (score 2), score 1 + 2 = 3 totally (A3); loss of the first and second toes (score 2 + 2 = 4) (A4); loss of the first and the second toes, half of the third toe, the total score of 2 + 2 + 1 = 5 (A5); the first, second and third toes are missing, the total score is 2 × 3 = 6 (A6). (B) At all time points except the 5th day (p > 0.05), the autotomy score between the SNT group and the other 2 experimental groups is statistically significantly different (*p < 0.05, @p < 0.05). (C) CatWalk XT recorded real-time walking footprints of each group of experimental animals on the 30th day after surgery (left), representative footprints of rats (middle), and detected the 3D signal intensity of footprints (right). (D) Quantification of Print area (cm2), Max intensity At (%) and Step cycle (s) in each group (@p < 0.05, @@p < 0.01, **p < 0.01).

