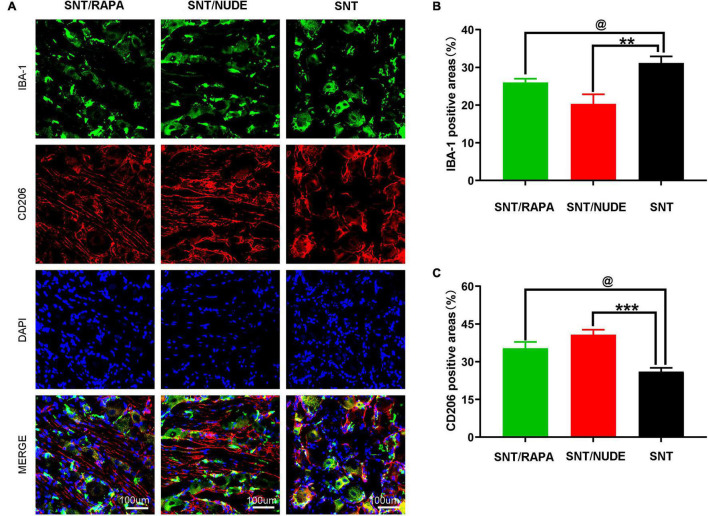
FIGURE 6.
Immunofluorescence staining results of M1 and M2 macrophages in DRG. (A) Representative photomicrographs of IBA-1 (green) and CD206 (red) immunofluorescence in each group. DAPI: Nuclear staining (blue). (100×, scale bar: 100um) (B,C) Quantification of IBA-1 and CD206 positive areas in each group (@p < 0.05 **p < 0.01, ***p < 0.001). Data are expressed as mean ± SEM, n = 6 rats per group. IBA-1: (SNT group: 31.167 ± 1.014; SNT/RAPA group: 26.001 ± 0.577; SNT/NUDE group: 20.333 ± 1.453); CD206: (SNT group: 26.033 ± 0.895; SNT/RAPA group: 35.333 ± 1.453; SNT/NUDE group: 40.700 ± 1.179).

